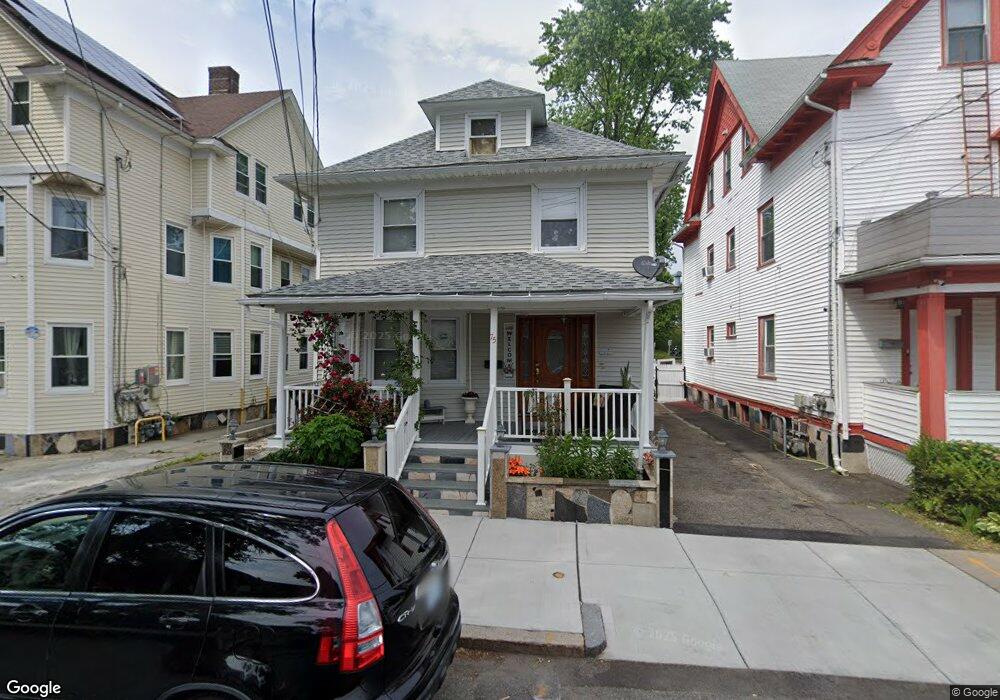
75 Hamlin St Providence, RI 02907
South Elmwood NeighborhoodEstimated Value: $357,000 - $391,000
3
Beds
2
Baths
1,516
Sq Ft
$251/Sq Ft
Est. Value
About This Home
This home is located at 75 Hamlin St, Providence, RI 02907 and is currently estimated at $380,042, approximately $250 per square foot. 75 Hamlin St is a home located in Providence County with nearby schools including Paul Cuffee High School and Sophia Academy.
Ownership History
Date
Name
Owned For
Owner Type
Purchase Details
Closed on
Jul 17, 2013
Sold by
Rodriguez Orlando and Rodriguez Maria
Bought by
Rodriguez Orlando and Rodriguez Maria
Current Estimated Value
Purchase Details
Closed on
Nov 23, 1993
Sold by
Citicorp Mtg Inc
Bought by
Rodriguez Orlando and Rodriguez Maria
Home Financials for this Owner
Home Financials are based on the most recent Mortgage that was taken out on this home.
Original Mortgage
$58,500
Interest Rate
6.77%
Purchase Details
Closed on
Mar 19, 1990
Sold by
Northern Mtg Fundin
Bought by
Evans Joseph
Home Financials for this Owner
Home Financials are based on the most recent Mortgage that was taken out on this home.
Original Mortgage
$82,800
Interest Rate
10.02%
Create a Home Valuation Report for This Property
The Home Valuation Report is an in-depth analysis detailing your home's value as well as a comparison with similar homes in the area
Home Values in the Area
Average Home Value in this Area
Purchase History
| Date | Buyer | Sale Price | Title Company |
|---|---|---|---|
| Rodriguez Orlando | -- | -- | |
| Rodriguez Orlando | $65,000 | -- | |
| Evans Joseph | $92,000 | -- |
Source: Public Records
Mortgage History
| Date | Status | Borrower | Loan Amount |
|---|---|---|---|
| Previous Owner | Evans Joseph | $58,500 | |
| Previous Owner | Evans Joseph | $82,800 |
Source: Public Records
Tax History
| Year | Tax Paid | Tax Assessment Tax Assessment Total Assessment is a certain percentage of the fair market value that is determined by local assessors to be the total taxable value of land and additions on the property. | Land | Improvement |
|---|---|---|---|---|
| 2025 | $2,937 | $349,600 | $128,000 | $221,600 |
| 2024 | $4,819 | $262,600 | $86,000 | $176,600 |
| 2023 | $4,819 | $262,600 | $86,000 | $176,600 |
| 2022 | $4,674 | $262,600 | $86,000 | $176,600 |
| 2021 | $4,841 | $197,100 | $54,900 | $142,200 |
| 2020 | $4,841 | $197,100 | $54,900 | $142,200 |
| 2019 | $4,841 | $197,100 | $54,900 | $142,200 |
| 2018 | $4,414 | $138,100 | $49,900 | $88,200 |
| 2017 | $4,414 | $138,100 | $49,900 | $88,200 |
| 2016 | $4,414 | $138,100 | $49,900 | $88,200 |
| 2015 | $4,045 | $122,200 | $38,800 | $83,400 |
| 2014 | $4,124 | $122,200 | $38,800 | $83,400 |
| 2013 | $4,124 | $122,200 | $38,800 | $83,400 |
Source: Public Records
Map
Nearby Homes
Your Personal Tour Guide
Ask me questions while you tour the home.