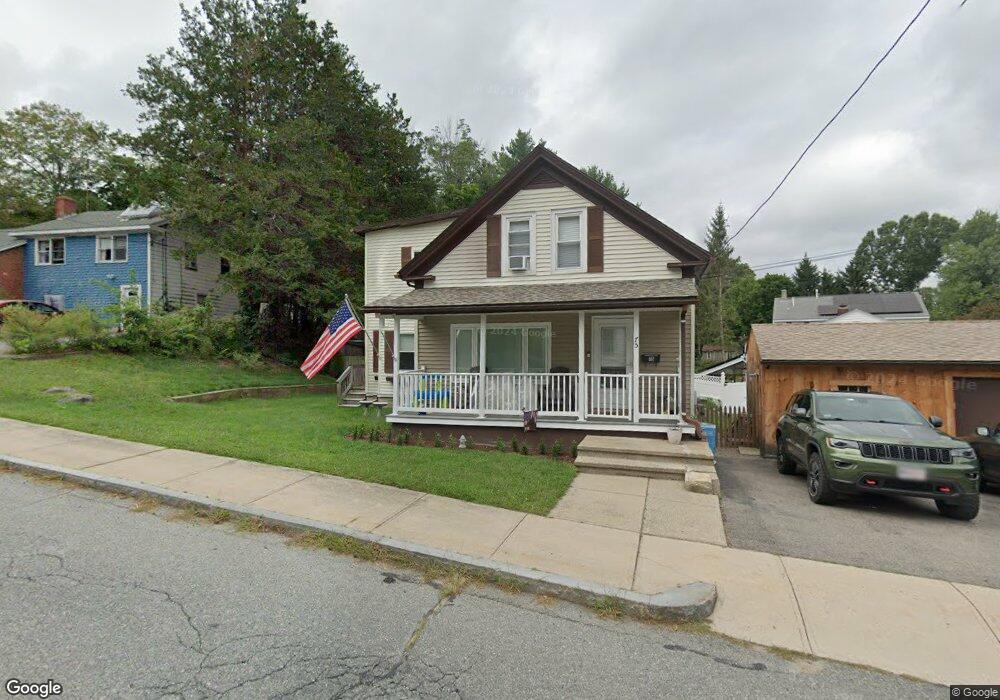
75 High St Uxbridge, MA 01569
Estimated Value: $442,689 - $498,000
3
Beds
1
Bath
2,101
Sq Ft
$220/Sq Ft
Est. Value
About This Home
This home is located at 75 High St, Uxbridge, MA 01569 and is currently estimated at $462,172, approximately $219 per square foot. 75 High St is a home located in Worcester County with nearby schools including Uxbridge High School, Our Lady of the Valley Regional School, and Whitinsville Christian School.
Ownership History
Date
Name
Owned For
Owner Type
Purchase Details
Closed on
Apr 1, 2019
Sold by
Martin David F and Lestha Linda M
Bought by
Martin Michael P
Current Estimated Value
Home Financials for this Owner
Home Financials are based on the most recent Mortgage that was taken out on this home.
Original Mortgage
$225,000
Outstanding Balance
$197,004
Interest Rate
4.3%
Mortgage Type
VA
Estimated Equity
$265,168
Create a Home Valuation Report for This Property
The Home Valuation Report is an in-depth analysis detailing your home's value as well as a comparison with similar homes in the area
Home Values in the Area
Average Home Value in this Area
Purchase History
| Date | Buyer | Sale Price | Title Company |
|---|---|---|---|
| Martin Michael P | $225,000 | -- | |
| Martin Michael P | $225,000 | -- |
Source: Public Records
Mortgage History
| Date | Status | Borrower | Loan Amount |
|---|---|---|---|
| Open | Martin Michael P | $225,000 | |
| Closed | Martin Michael P | $225,000 |
Source: Public Records
Tax History
| Year | Tax Paid | Tax Assessment Tax Assessment Total Assessment is a certain percentage of the fair market value that is determined by local assessors to be the total taxable value of land and additions on the property. | Land | Improvement |
|---|---|---|---|---|
| 2025 | $48 | $367,300 | $128,100 | $239,200 |
| 2024 | $4,412 | $341,500 | $117,400 | $224,100 |
| 2023 | $4,412 | $316,300 | $106,700 | $209,600 |
| 2022 | $4,161 | $274,500 | $96,800 | $177,700 |
| 2021 | $4,275 | $270,200 | $92,500 | $177,700 |
| 2020 | $4,193 | $250,500 | $96,000 | $154,500 |
| 2019 | $4,096 | $236,100 | $88,900 | $147,200 |
| 2018 | $3,906 | $227,500 | $88,900 | $138,600 |
| 2017 | $4,072 | $240,100 | $76,200 | $163,900 |
| 2016 | $3,737 | $212,700 | $67,500 | $145,200 |
| 2015 | $3,656 | $210,100 | $67,500 | $142,600 |
Source: Public Records
Map
Nearby Homes
- 79 High St
- 95 High St Unit C
- 5 Peter St Unit D
- 16 Farnum St
- 86 Hunter Rd
- 30 Glendale Ave
- 197 Crownshield Ave Unit 16B
- 197 Crownshield Ave Unit 16A
- 197 Crownshield Ave Unit 16C
- 209 Crownshield Ave Unit 19B
- 117 Quaker Hwy Unit 29
- 61 Spring Hill Dr Unit 61
- 223 Mendon St
- 376 Douglas St
- 395 High St
- 44 Pouts Ln
- 71 Rivulet St Unit B
- 35 Pouts Ln
- 35 Beverly Ave
- 150 Hazel St
- 6 Mary Jane Ave
- 70 High St
- 67 High St
- 14 Mary Jane Ave
- 64 High St
- 61 High St
- 15 Mary Jane Ave
- 95 High St Unit G
- 95 High St Unit E
- 95 High St Unit D
- 95 High St Unit B
- 95 High St Unit A
- 95 High St Unit E,1
- 95 B High St Unit B1
- 18 Mary Jane Ave
- 60 High St
- 55 High St
- 55 High St Unit 1
- 55 High St Unit 2
- 23 Mary Jane Ave
Your Personal Tour Guide
Ask me questions while you tour the home.