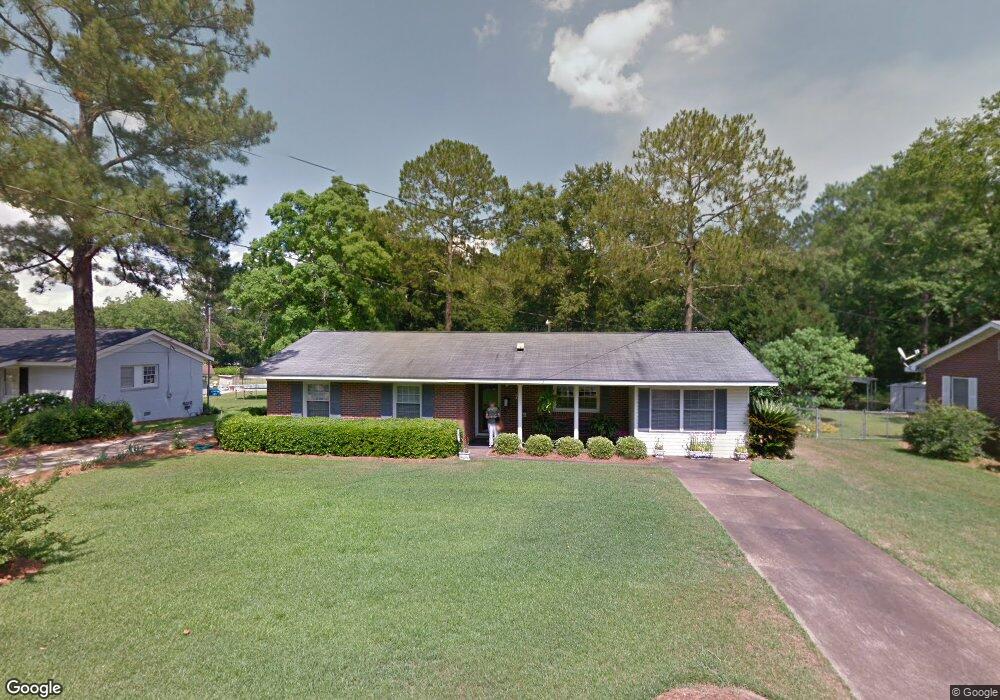
75 Hobbs St Blakely, GA 39823
Estimated Value: $124,000 - $148,000
3
Beds
3
Baths
1,903
Sq Ft
$73/Sq Ft
Est. Value
About This Home
This home is located at 75 Hobbs St, Blakely, GA 39823 and is currently estimated at $139,163, approximately $73 per square foot. 75 Hobbs St is a home located in Early County with nearby schools including Early County Elementary School, Early County Middle School, and Early County High School.
Ownership History
Date
Name
Owned For
Owner Type
Purchase Details
Closed on
Dec 10, 2013
Sold by
Peavy Julian Bernard
Bought by
Peavy Janice Jones
Current Estimated Value
Purchase Details
Closed on
May 26, 2004
Sold by
Jones Robert and Jones Joyce
Bought by
Peavy Bernard
Purchase Details
Closed on
May 21, 1968
Bought by
Peavy Bernard
Create a Home Valuation Report for This Property
The Home Valuation Report is an in-depth analysis detailing your home's value as well as a comparison with similar homes in the area
Home Values in the Area
Average Home Value in this Area
Purchase History
| Date | Buyer | Sale Price | Title Company |
|---|---|---|---|
| Peavy Janice Jones | -- | -- | |
| Peavy Bernard | -- | -- | |
| Peavy Bernard | -- | -- |
Source: Public Records
Tax History
| Year | Tax Paid | Tax Assessment Tax Assessment Total Assessment is a certain percentage of the fair market value that is determined by local assessors to be the total taxable value of land and additions on the property. | Land | Improvement |
|---|---|---|---|---|
| 2024 | $707 | $48,682 | $2,400 | $46,282 |
| 2023 | $294 | $48,682 | $2,400 | $46,282 |
| 2022 | $472 | $47,856 | $2,400 | $45,456 |
| 2021 | $860 | $41,426 | $2,400 | $39,026 |
| 2020 | $842 | $41,426 | $2,400 | $39,026 |
| 2019 | $787 | $38,262 | $2,400 | $35,862 |
| 2018 | $950 | $38,262 | $2,400 | $35,862 |
| 2017 | $950 | $38,262 | $2,400 | $35,862 |
| 2016 | $836 | $34,841 | $2,400 | $32,441 |
| 2015 | -- | $35,981 | $2,400 | $33,581 |
| 2014 | -- | $35,981 | $2,400 | $33,581 |
| 2013 | -- | $36,464 | $2,400 | $34,064 |
Source: Public Records
Map
Nearby Homes
- 74 S Lancelot St
- 93 Arnall Blvd
- 96 Jesse Johnson Dr
- 2019 S Main St
- 187 Evergreen Ave
- 600 Chattahoochee Ave
- 00 Garden Dr
- 76 S Jefferson Ave
- 556 Flowers Dr
- 311 Flowers Dr
- 73 Grove Place
- 337 College St
- 439 S Flowers Dr
- 11401 Columbia St
- 8 Lots Unknown Ln
- 23 Dothan Rd
- 0080012 Old Lucile Rd
- 934 Southside Dr
- 0 Dasaree Ln Unit 10683861
- 0 Dasaree Ln Unit 7713301
Your Personal Tour Guide
Ask me questions while you tour the home.