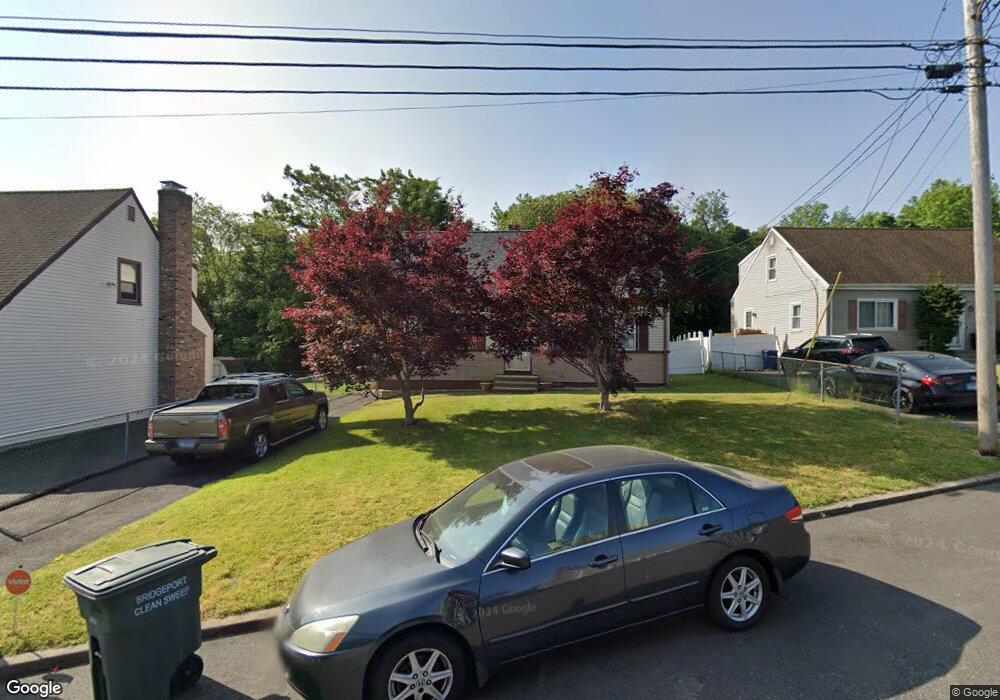
75 Holland Hill Cir Bridgeport, CT 06610
North Bridgeport NeighborhoodEstimated Value: $374,000 - $453,000
3
Beds
3
Baths
1,512
Sq Ft
$280/Sq Ft
Est. Value
About This Home
This home is located at 75 Holland Hill Cir, Bridgeport, CT 06610 and is currently estimated at $422,769, approximately $279 per square foot. 75 Holland Hill Cir is a home located in Fairfield County with nearby schools including Hooker School, Harding High School, and St Catherine of Siena School.
Ownership History
Date
Name
Owned For
Owner Type
Purchase Details
Closed on
Jun 16, 2003
Sold by
Mcarthur Frank and Mcarthur Sherley
Bought by
Matos Rafael O and Matos Noenil
Current Estimated Value
Home Financials for this Owner
Home Financials are based on the most recent Mortgage that was taken out on this home.
Original Mortgage
$152,000
Outstanding Balance
$66,535
Interest Rate
5.77%
Estimated Equity
$356,234
Purchase Details
Closed on
Dec 21, 1999
Sold by
Cunningham-Coombs G
Bought by
Mcarthur Shirley and Mcarthur Frank
Home Financials for this Owner
Home Financials are based on the most recent Mortgage that was taken out on this home.
Original Mortgage
$139,900
Interest Rate
7.81%
Purchase Details
Closed on
Jun 27, 1996
Sold by
Ford Consumer Finance
Bought by
Cunningham-Coombs G
Create a Home Valuation Report for This Property
The Home Valuation Report is an in-depth analysis detailing your home's value as well as a comparison with similar homes in the area
Home Values in the Area
Average Home Value in this Area
Purchase History
| Date | Buyer | Sale Price | Title Company |
|---|---|---|---|
| Matos Rafael O | $190,000 | -- | |
| Matos Rafael O | $190,000 | -- | |
| Mcarthur Shirley | $140,000 | -- | |
| Mcarthur Shirley | $140,000 | -- | |
| Cunningham-Coombs G | $95,000 | -- | |
| Cunningham-Coombs G | $95,000 | -- |
Source: Public Records
Mortgage History
| Date | Status | Borrower | Loan Amount |
|---|---|---|---|
| Open | Cunningham-Coombs G | $152,000 | |
| Closed | Cunningham-Coombs G | $152,000 | |
| Previous Owner | Cunningham-Coombs G | $139,900 |
Source: Public Records
Tax History Compared to Growth
Tax History
| Year | Tax Paid | Tax Assessment Tax Assessment Total Assessment is a certain percentage of the fair market value that is determined by local assessors to be the total taxable value of land and additions on the property. | Land | Improvement |
|---|---|---|---|---|
| 2025 | $6,690 | $153,970 | $65,700 | $88,270 |
| 2024 | $6,690 | $153,970 | $65,700 | $88,270 |
| 2023 | $6,690 | $153,970 | $65,700 | $88,270 |
| 2022 | $6,690 | $153,970 | $65,700 | $88,270 |
| 2021 | $6,690 | $153,970 | $65,700 | $88,270 |
| 2020 | $7,154 | $132,510 | $58,040 | $74,470 |
| 2019 | $7,154 | $132,510 | $58,040 | $74,470 |
| 2018 | $7,205 | $132,510 | $58,040 | $74,470 |
| 2017 | $7,205 | $132,510 | $58,040 | $74,470 |
| 2016 | $7,205 | $132,510 | $58,040 | $74,470 |
| 2015 | $6,763 | $160,270 | $55,160 | $105,110 |
| 2014 | $6,763 | $160,270 | $55,160 | $105,110 |
Source: Public Records
Map
Nearby Homes
- 115 Silver St
- 375 Silver St
- 3699 Broadbridge Ave Unit 107
- 450 Emerald Place
- 275 Roger Williams Rd
- 11 Knollcrest Dr
- 374 Mapledale Place
- 69 Glen Cir
- 80 Daniel Dr
- 50 Pilgrim Rd
- 123 Beverly Dr
- 53 Beverly Dr
- 165 Nutmeg Rd
- 197 Dupont Place Unit 199
- 410 Seabreeze Dr
- 2921 Nichols Ave
- 181 Islandview Rd
- 29 Old Town Dr
- 72 Broadmere Rd
- 1618 Nichols Ave
- 65 Holland Hill Cir
- 95 Holland Hill Cir
- 70 Holland Hill Cir
- 390 Holland Rd
- 45 Holland Hill Cir
- 105 Holland Hill Cir
- 90 Holland Hill Cir
- 125 Holland Hill Cir
- 370 Holland Rd
- 120 Holland Hill Cir
- 50 Holland Hill Cir
- 360 Holland Rd
- 30 Holland Hill Cir
- 20 Holland Hill Cir
- 135 Holland Hill Cir
- 130 Holland Hill Cir
- 184 Holland Rd
- 408 Holland Rd
- 194 Holland Rd
- 40 Sullivan Place