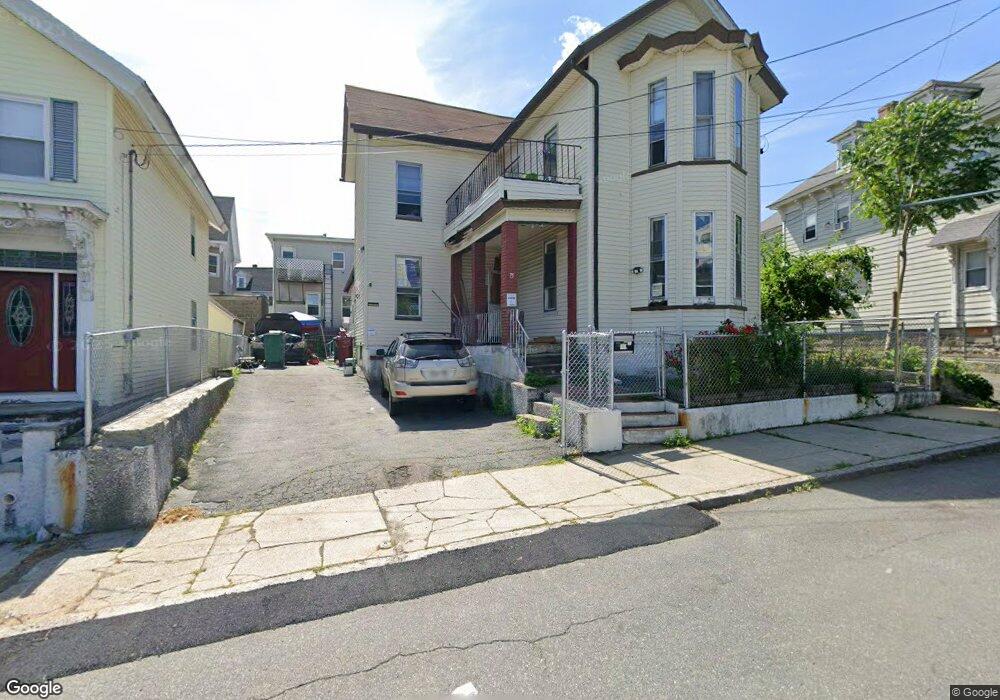
75 Howard St Lowell, MA 01851
Lower Highlands NeighborhoodEstimated Value: $468,000 - $541,000
4
Beds
2
Baths
2,116
Sq Ft
$233/Sq Ft
Est. Value
About This Home
This home is located at 75 Howard St, Lowell, MA 01851 and is currently estimated at $493,218, approximately $233 per square foot. 75 Howard St is a home located in Middlesex County with nearby schools including Abraham Lincoln Elementary School, Charles W. Morey Elementary School, and Charlotte M. Murkland Elementary School.
Ownership History
Date
Name
Owned For
Owner Type
Purchase Details
Closed on
Oct 22, 2024
Sold by
Reum Sou and Zhan Porloui
Bought by
Reum Sou
Current Estimated Value
Purchase Details
Closed on
Jul 1, 2024
Sold by
Reum Sou
Bought by
Reum Sou and Zhan Porloui
Purchase Details
Closed on
Nov 23, 2016
Sold by
Zhan Porloui and Reum Sou
Bought by
Reum Sou
Purchase Details
Closed on
Nov 13, 2006
Sold by
Wells Fargo Bk Na
Bought by
Zhan Porloui and Reum Sou
Home Financials for this Owner
Home Financials are based on the most recent Mortgage that was taken out on this home.
Original Mortgage
$218,250
Interest Rate
6.31%
Mortgage Type
Purchase Money Mortgage
Purchase Details
Closed on
Dec 3, 2004
Sold by
Costa John D and Aubrey Kimberly Ann
Bought by
Touch Toeurn
Home Financials for this Owner
Home Financials are based on the most recent Mortgage that was taken out on this home.
Original Mortgage
$264,174
Interest Rate
5.69%
Mortgage Type
Purchase Money Mortgage
Create a Home Valuation Report for This Property
The Home Valuation Report is an in-depth analysis detailing your home's value as well as a comparison with similar homes in the area
Home Values in the Area
Average Home Value in this Area
Purchase History
| Date | Buyer | Sale Price | Title Company |
|---|---|---|---|
| Reum Sou | -- | None Available | |
| Reum Sou | -- | None Available | |
| Reum Sou | -- | None Available | |
| Reum Sou | -- | None Available | |
| Reum Sou | -- | -- | |
| Reum Sou | -- | -- | |
| Zhan Porloui | $225,000 | -- | |
| Zhan Porloui | $225,000 | -- | |
| Touch Toeurn | $274,000 | -- | |
| Touch Toeurn | $274,000 | -- |
Source: Public Records
Mortgage History
| Date | Status | Borrower | Loan Amount |
|---|---|---|---|
| Previous Owner | Zhan Porloui | $218,250 | |
| Previous Owner | Touch Toeurn | $264,174 |
Source: Public Records
Tax History
| Year | Tax Paid | Tax Assessment Tax Assessment Total Assessment is a certain percentage of the fair market value that is determined by local assessors to be the total taxable value of land and additions on the property. | Land | Improvement |
|---|---|---|---|---|
| 2025 | $5,164 | $449,800 | $109,900 | $339,900 |
| 2024 | $4,803 | $403,300 | $102,800 | $300,500 |
| 2023 | $4,465 | $359,500 | $89,400 | $270,100 |
| 2022 | $3,996 | $314,900 | $70,600 | $244,300 |
| 2021 | $3,706 | $275,300 | $61,400 | $213,900 |
| 2020 | $3,456 | $258,700 | $61,400 | $197,300 |
| 2019 | $3,311 | $235,800 | $58,400 | $177,400 |
| 2018 | $3,087 | $214,500 | $55,600 | $158,900 |
| 2017 | $2,968 | $198,900 | $53,900 | $145,000 |
| 2016 | $2,958 | $195,100 | $50,100 | $145,000 |
| 2015 | $2,709 | $175,000 | $50,100 | $124,900 |
| 2013 | $2,496 | $166,300 | $60,100 | $106,200 |
Source: Public Records
Map
Nearby Homes
- 45 Marshall St
- 143 Westford St
- 201 Thorndike St Unit 501
- 201 Thorndike St Unit 2-312
- 201 Thorndike St Unit 505
- 191 Thorndike St Unit 26
- 42 Branch St
- 68 Smith St
- 491 Dutton St Unit 305
- 491 Dutton St Unit 409
- 491 Dutton St Unit 504
- 95 S Highland St
- 84 Cambridge St
- 15 Barclay St
- 278-316 Middlesex St
- 3 Butman Place
- 30 Grace St
- 710 School St
- 18 Burgess St
- 5 Floyd St
- 81 Howard St
- 72 Grand St
- 74 Grand St
- 74 Grand St Unit 2
- 74 Grand St Unit 1
- 74 Grand St Unit 2nd Floor
- 83 Howard St Unit 2
- 83 Howard St
- 83 Howard St Unit 1
- 82 Grand St Unit 3rd Floor
- 82 Grand St Unit 1B
- 82 Grand St Unit 2
- 82 Grand St Unit 1st Fl
- 82 Grand St Unit 1st-Front
- 82 Grand St Unit 1st Fl-R
- 82 Grand St Unit 1st Fl,Frnt
- 82 Grand St Unit 1st Fl,Rear
- 82 Grand St
- 82 Grand St Unit 3
- 93 Chelmsford St
Your Personal Tour Guide
Ask me questions while you tour the home.