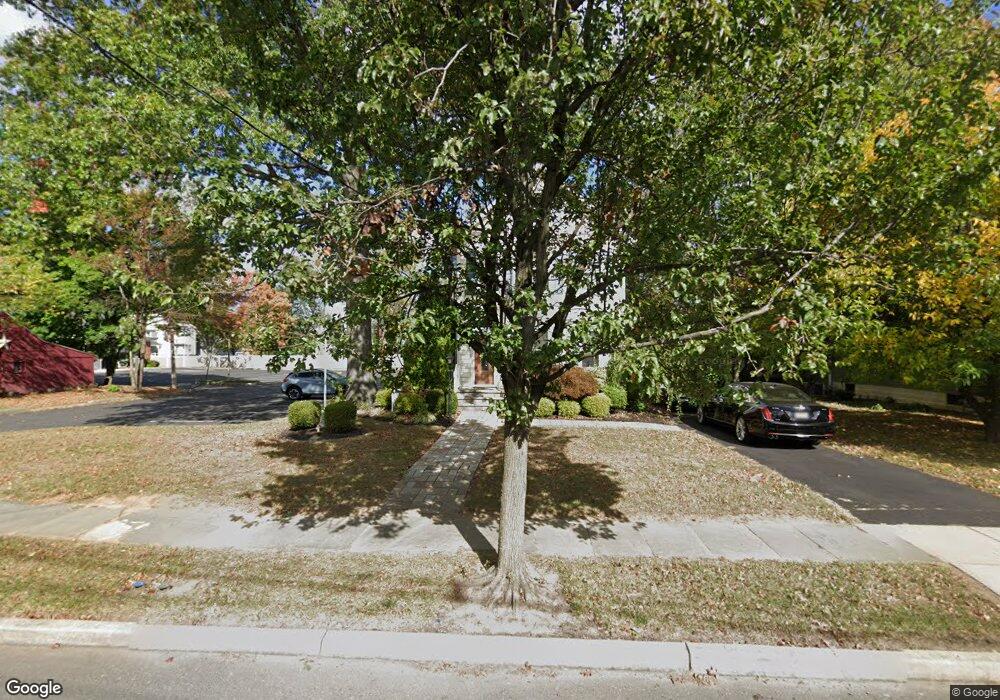
75 Hull Ave Freehold, NJ 07728
Estimated Value: $601,289 - $676,000
4
Beds
2
Baths
2,249
Sq Ft
$289/Sq Ft
Est. Value
About This Home
This home is located at 75 Hull Ave, Freehold, NJ 07728 and is currently estimated at $649,072, approximately $288 per square foot. 75 Hull Ave is a home located in Monmouth County with nearby schools including Park Avenue Elementary School, Freehold Intermediate School, and Freehold Borough High School.
Ownership History
Date
Name
Owned For
Owner Type
Purchase Details
Closed on
Aug 1, 2006
Sold by
Driscoll Kim
Bought by
Driscoll Patrick T
Current Estimated Value
Purchase Details
Closed on
Nov 29, 1999
Sold by
Tovey Louis
Bought by
Driscoll Patrick and Driscoll Kim
Home Financials for this Owner
Home Financials are based on the most recent Mortgage that was taken out on this home.
Original Mortgage
$139,261
Interest Rate
7.98%
Mortgage Type
FHA
Create a Home Valuation Report for This Property
The Home Valuation Report is an in-depth analysis detailing your home's value as well as a comparison with similar homes in the area
Home Values in the Area
Average Home Value in this Area
Purchase History
| Date | Buyer | Sale Price | Title Company |
|---|---|---|---|
| Driscoll Patrick T | $100,000 | Lawyers Title Insurance Corp | |
| Driscoll Patrick | $166,500 | -- |
Source: Public Records
Mortgage History
| Date | Status | Borrower | Loan Amount |
|---|---|---|---|
| Previous Owner | Driscoll Patrick | $139,261 |
Source: Public Records
Tax History Compared to Growth
Tax History
| Year | Tax Paid | Tax Assessment Tax Assessment Total Assessment is a certain percentage of the fair market value that is determined by local assessors to be the total taxable value of land and additions on the property. | Land | Improvement |
|---|---|---|---|---|
| 2025 | $9,686 | $544,000 | $277,000 | $267,000 |
| 2024 | $10,189 | $482,600 | $220,500 | $262,100 |
| 2023 | $10,189 | $485,900 | $229,900 | $256,000 |
| 2022 | $9,055 | $393,100 | $160,000 | $233,100 |
| 2021 | $9,055 | $345,200 | $133,300 | $211,900 |
| 2020 | $8,928 | $335,400 | $133,300 | $202,100 |
| 2019 | $9,810 | $370,200 | $133,300 | $236,900 |
| 2018 | $9,880 | $365,800 | $133,300 | $232,500 |
| 2017 | $9,839 | $362,800 | $133,300 | $229,500 |
| 2016 | $8,764 | $330,100 | $140,500 | $189,600 |
| 2015 | $8,618 | $340,100 | $150,500 | $189,600 |
| 2014 | $8,227 | $340,100 | $150,500 | $189,600 |
Source: Public Records
Map
Nearby Homes