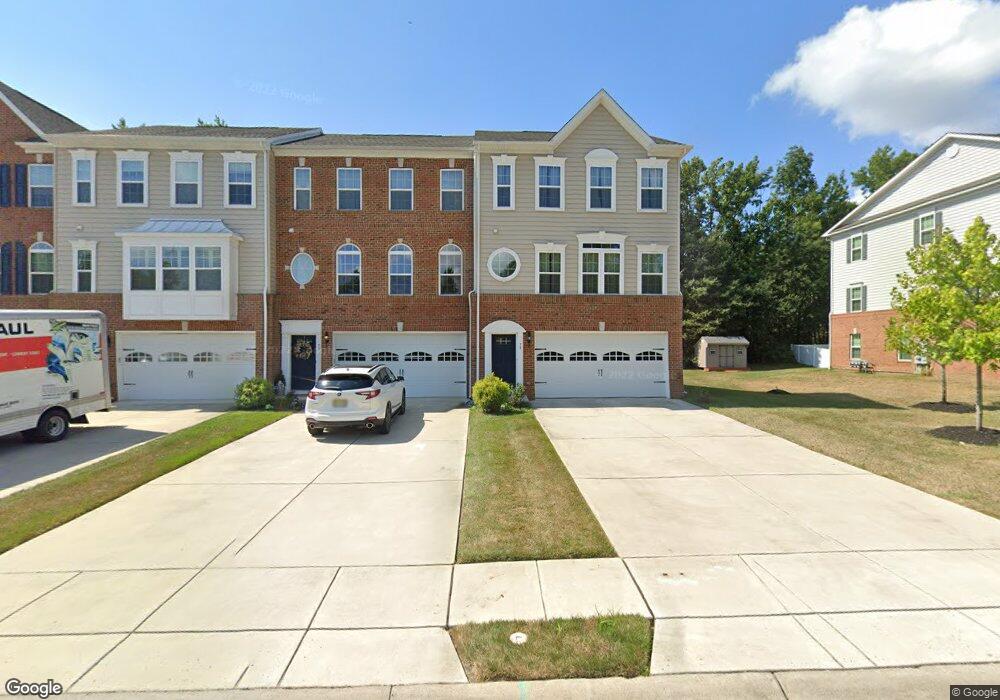
75 Isabelle Ct Evesham, NJ 08053
Estimated Value: $602,000 - $672,000
3
Beds
4
Baths
2,876
Sq Ft
$219/Sq Ft
Est. Value
About This Home
This home is located at 75 Isabelle Ct, Evesham, NJ 08053 and is currently estimated at $630,416, approximately $219 per square foot. 75 Isabelle Ct is a home located in Burlington County with nearby schools including H.L. Beeler Elementary School, Frances Demasi Middle School, and Lenape High School.
Ownership History
Date
Name
Owned For
Owner Type
Purchase Details
Closed on
Sep 8, 2016
Sold by
Nvr Inc
Bought by
Kite Justin
Current Estimated Value
Home Financials for this Owner
Home Financials are based on the most recent Mortgage that was taken out on this home.
Original Mortgage
$318,250
Outstanding Balance
$254,206
Interest Rate
3.43%
Mortgage Type
New Conventional
Estimated Equity
$376,210
Purchase Details
Closed on
May 16, 2016
Sold by
Mi Pro Homes Llc
Bought by
Nvr Inc and Ryan Homes
Create a Home Valuation Report for This Property
The Home Valuation Report is an in-depth analysis detailing your home's value as well as a comparison with similar homes in the area
Home Values in the Area
Average Home Value in this Area
Purchase History
| Date | Buyer | Sale Price | Title Company |
|---|---|---|---|
| Kite Justin | $397,871 | Title American Agency Corp | |
| Nvr Inc | $105,000 | Title America |
Source: Public Records
Mortgage History
| Date | Status | Borrower | Loan Amount |
|---|---|---|---|
| Open | Kite Justin | $318,250 |
Source: Public Records
Tax History
| Year | Tax Paid | Tax Assessment Tax Assessment Total Assessment is a certain percentage of the fair market value that is determined by local assessors to be the total taxable value of land and additions on the property. | Land | Improvement |
|---|---|---|---|---|
| 2025 | $13,319 | $390,000 | $75,000 | $315,000 |
| 2024 | $12,531 | $390,000 | $75,000 | $315,000 |
| 2023 | $12,531 | $390,000 | $75,000 | $315,000 |
| 2022 | $11,969 | $390,000 | $75,000 | $315,000 |
| 2021 | $11,688 | $390,000 | $75,000 | $315,000 |
| 2020 | $11,536 | $390,000 | $75,000 | $315,000 |
| 2019 | $11,443 | $390,000 | $75,000 | $315,000 |
| 2018 | $11,283 | $390,000 | $75,000 | $315,000 |
| 2017 | $11,150 | $390,000 | $75,000 | $315,000 |
| 2016 | $2,092 | $75,000 | $75,000 | $0 |
| 2015 | $2,055 | $75,000 | $75,000 | $0 |
| 2014 | $985 | $37,000 | $37,000 | $0 |
Source: Public Records
Map
Nearby Homes
- 62 Isabelle Ct
- 87 Isabelle Ct
- 44 Mitchell Ct
- 13 Crane Dr
- 17 Goldenrod Ln
- 31 Sullivan Way
- 14 Eddy Way
- 31 Eddy Way
- 35 Huxley Cir
- 169 Crown Prince Dr
- 174 Crown Prince Dr
- 10 Larkspur Dr
- 5 Tara Dr
- 14 Crofton Chase Ct
- 5903 Baltimore Dr
- 1207 Delancey Way Unit 1207
- 6401 Baltimore Dr Unit 6401
- 2205 Delancey Way Unit 2205
- 14 Daylily Dr
- 294 Hartford Rd
Your Personal Tour Guide
Ask me questions while you tour the home.