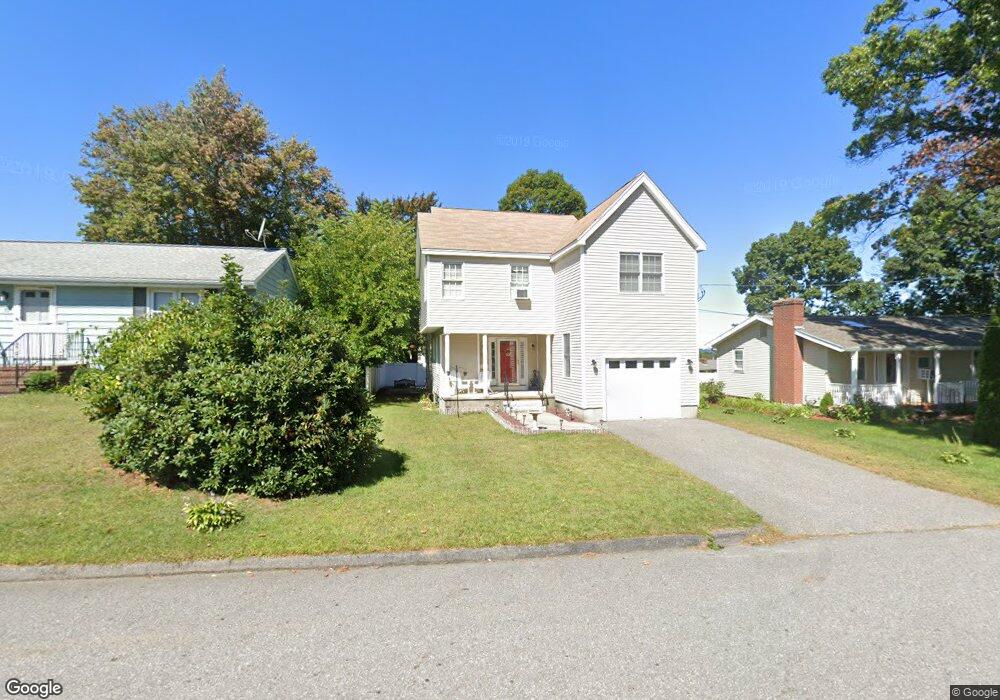
75 Jennings St Worcester, MA 01604
Grafton Hill NeighborhoodEstimated Value: $449,310 - $544,000
3
Beds
3
Baths
1,638
Sq Ft
$295/Sq Ft
Est. Value
About This Home
This home is located at 75 Jennings St, Worcester, MA 01604 and is currently estimated at $482,828, approximately $294 per square foot. 75 Jennings St is a home located in Worcester County with nearby schools including Roosevelt Elementary School, Jacob Hiatt Magnet School, and Chandler Magnet.
Ownership History
Date
Name
Owned For
Owner Type
Purchase Details
Closed on
Nov 15, 1995
Sold by
West Valley Corp
Bought by
Dipilato Deborah
Current Estimated Value
Home Financials for this Owner
Home Financials are based on the most recent Mortgage that was taken out on this home.
Original Mortgage
$104,000
Outstanding Balance
$1,445
Interest Rate
7.53%
Mortgage Type
Purchase Money Mortgage
Estimated Equity
$481,383
Purchase Details
Closed on
Jun 14, 1995
Sold by
Ciccone Fiore
Bought by
West Valley Corp
Create a Home Valuation Report for This Property
The Home Valuation Report is an in-depth analysis detailing your home's value as well as a comparison with similar homes in the area
Home Values in the Area
Average Home Value in this Area
Purchase History
We collect this data history from publicly available records. To have your information removed, we recommend requesting removal directly through your county’s website.
| Date | Buyer | Sale Price | Title Company |
|---|---|---|---|
| Dipilato Deborah | $130,000 | -- | |
| West Valley Corp | $15,000 | -- |
Source: Public Records
Mortgage History
We collect this data history from publicly available records. To have your information removed, we recommend requesting removal directly through your county’s website.
| Date | Status | Borrower | Loan Amount |
|---|---|---|---|
| Closed | West Valley Corp | $30,000 | |
| Open | West Valley Corp | $104,000 |
Source: Public Records
Tax History
| Year | Tax Paid | Tax Assessment Tax Assessment Total Assessment is a certain percentage of the fair market value that is determined by local assessors to be the total taxable value of land and additions on the property. | Land | Improvement |
|---|---|---|---|---|
| 2025 | $5,291 | $401,100 | $94,300 | $306,800 |
| 2024 | $5,163 | $375,500 | $94,300 | $281,200 |
| 2023 | $4,987 | $347,800 | $82,000 | $265,800 |
| 2022 | $4,809 | $316,200 | $65,700 | $250,500 |
| 2021 | $4,666 | $286,600 | $52,500 | $234,100 |
| 2020 | $4,779 | $281,100 | $52,500 | $228,600 |
| 2019 | $4,433 | $246,300 | $47,300 | $199,000 |
| 2018 | $4,510 | $238,500 | $47,300 | $191,200 |
| 2017 | $4,284 | $222,900 | $47,300 | $175,600 |
| 2016 | $4,307 | $209,000 | $35,200 | $173,800 |
| 2015 | $4,195 | $209,000 | $35,200 | $173,800 |
| 2014 | $4,084 | $209,000 | $35,200 | $173,800 |
Source: Public Records
Map
Nearby Homes
Your Personal Tour Guide
Ask me questions while you tour the home.