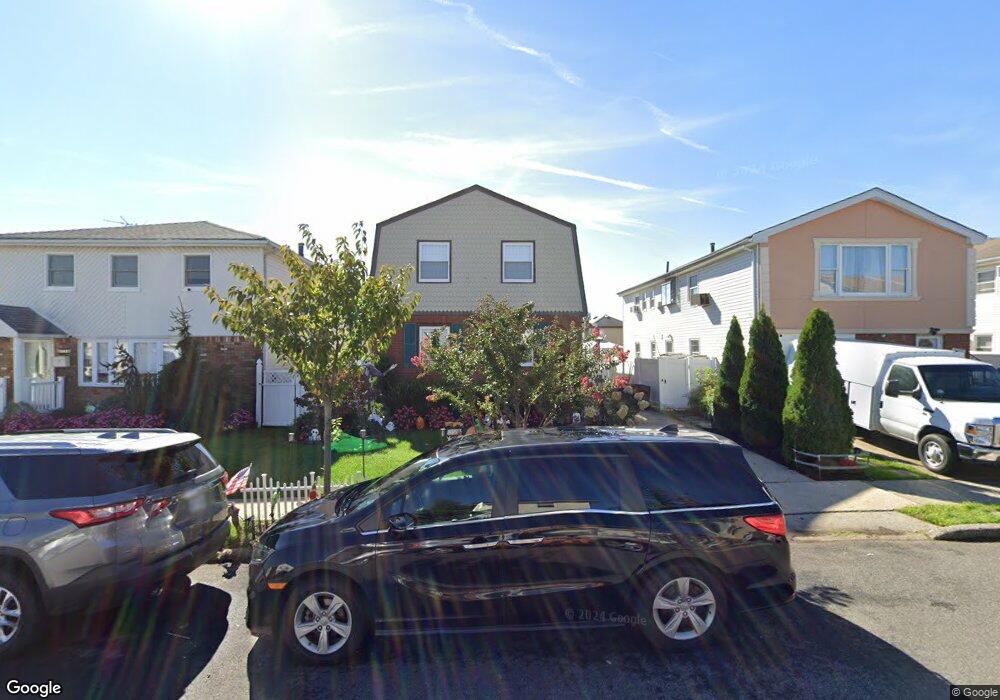
75 Kenmore St Unit 1 Staten Island, NY 10312
Arden Heights NeighborhoodEstimated Value: $827,000 - $860,219
4
Beds
2
Baths
2,184
Sq Ft
$385/Sq Ft
Est. Value
About This Home
This home is located at 75 Kenmore St Unit 1, Staten Island, NY 10312 and is currently estimated at $840,805, approximately $384 per square foot. 75 Kenmore St Unit 1 is a home located in Richmond County with nearby schools including P.S. 42 The Eltingville School, I.S. 075 Frank D. Paulo, and Tottenville High School.
Ownership History
Date
Name
Owned For
Owner Type
Purchase Details
Closed on
May 20, 2016
Sold by
Larsen Roanld A and Larsen Lynette
Bought by
Hellman Dennis P and Hellman Tracey
Current Estimated Value
Home Financials for this Owner
Home Financials are based on the most recent Mortgage that was taken out on this home.
Original Mortgage
$427,200
Outstanding Balance
$339,526
Interest Rate
3.61%
Mortgage Type
New Conventional
Estimated Equity
$501,279
Purchase Details
Closed on
Aug 31, 2001
Sold by
Corr James M and Corr Alice
Bought by
Larsen Ronald A and Larsen Lynette
Home Financials for this Owner
Home Financials are based on the most recent Mortgage that was taken out on this home.
Original Mortgage
$235,000
Interest Rate
6.93%
Create a Home Valuation Report for This Property
The Home Valuation Report is an in-depth analysis detailing your home's value as well as a comparison with similar homes in the area
Home Values in the Area
Average Home Value in this Area
Purchase History
| Date | Buyer | Sale Price | Title Company |
|---|---|---|---|
| Hellman Dennis P | $534,000 | The Judicial Title Ins Agenc | |
| Larsen Ronald A | $315,000 | Old Republic Natl Title Ins |
Source: Public Records
Mortgage History
| Date | Status | Borrower | Loan Amount |
|---|---|---|---|
| Open | Hellman Dennis P | $427,200 | |
| Previous Owner | Larsen Ronald A | $235,000 |
Source: Public Records
Tax History Compared to Growth
Tax History
| Year | Tax Paid | Tax Assessment Tax Assessment Total Assessment is a certain percentage of the fair market value that is determined by local assessors to be the total taxable value of land and additions on the property. | Land | Improvement |
|---|---|---|---|---|
| 2025 | $7,150 | $47,640 | $7,889 | $39,751 |
| 2024 | $7,150 | $43,860 | $8,084 | $35,776 |
| 2023 | $7,031 | $34,618 | $6,957 | $27,661 |
| 2022 | $6,520 | $40,740 | $9,960 | $30,780 |
| 2021 | $6,873 | $40,440 | $9,960 | $30,480 |
| 2020 | $6,656 | $40,140 | $9,960 | $30,180 |
| 2019 | $6,205 | $38,520 | $9,960 | $28,560 |
| 2018 | $5,881 | $28,848 | $8,372 | $20,476 |
| 2017 | $5,248 | $27,216 | $9,072 | $18,144 |
| 2016 | $5,131 | $27,216 | $9,511 | $17,705 |
| 2015 | $4,439 | $26,203 | $7,320 | $18,883 |
| 2014 | $4,439 | $24,720 | $8,280 | $16,440 |
Source: Public Records
Map
Nearby Homes