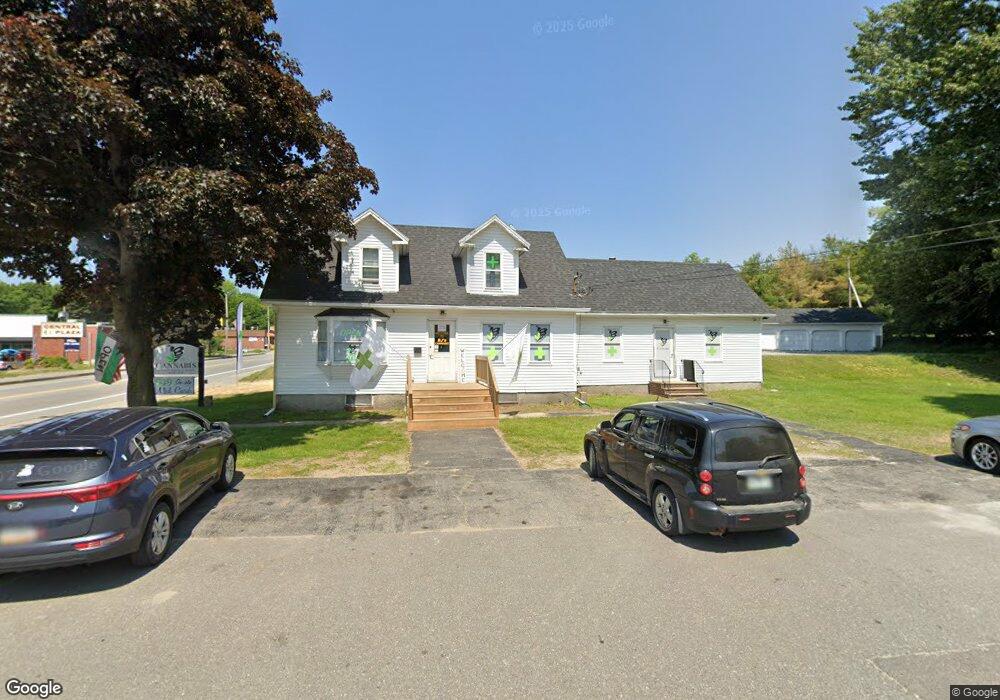
75 Main St Livermore Falls, ME 04254
Estimated Value: $148,000 - $182,502
2
Beds
2
Baths
2,018
Sq Ft
$80/Sq Ft
Est. Value
About This Home
This home is located at 75 Main St, Livermore Falls, ME 04254 and is currently estimated at $162,376, approximately $80 per square foot. 75 Main St is a home located in Androscoggin County with nearby schools including Spruce Mountain Primary School, Spruce Mountain Elementary School, and Spruce Mountain Middle School.
Ownership History
Date
Name
Owned For
Owner Type
Purchase Details
Closed on
Jul 8, 2022
Sold by
Creps Rose
Bought by
Tarrant Robert L
Current Estimated Value
Home Financials for this Owner
Home Financials are based on the most recent Mortgage that was taken out on this home.
Original Mortgage
$140,000
Outstanding Balance
$132,817
Interest Rate
5.1%
Mortgage Type
Purchase Money Mortgage
Estimated Equity
$29,559
Purchase Details
Closed on
Dec 28, 2021
Sold by
Friedman Matthew and Dubord Kristen
Bought by
Creps Rose
Home Financials for this Owner
Home Financials are based on the most recent Mortgage that was taken out on this home.
Original Mortgage
$66,500
Interest Rate
3.11%
Mortgage Type
Purchase Money Mortgage
Purchase Details
Closed on
Dec 26, 2007
Sold by
Dubord Lionel D Est and Shutty
Bought by
Dubord Kristen and Friedman Matthew
Home Financials for this Owner
Home Financials are based on the most recent Mortgage that was taken out on this home.
Original Mortgage
$95,000
Interest Rate
6.27%
Mortgage Type
Purchase Money Mortgage
Create a Home Valuation Report for This Property
The Home Valuation Report is an in-depth analysis detailing your home's value as well as a comparison with similar homes in the area
Home Values in the Area
Average Home Value in this Area
Purchase History
| Date | Buyer | Sale Price | Title Company |
|---|---|---|---|
| Tarrant Robert L | $140,000 | None Available | |
| Creps Rose | -- | None Available | |
| Dubord Kristen | -- | -- |
Source: Public Records
Mortgage History
| Date | Status | Borrower | Loan Amount |
|---|---|---|---|
| Open | Tarrant Robert L | $140,000 | |
| Previous Owner | Creps Rose | $66,500 | |
| Previous Owner | Dubord Kristen | $95,000 | |
| Previous Owner | Dubord Kristen | $95,000 |
Source: Public Records
Tax History Compared to Growth
Tax History
| Year | Tax Paid | Tax Assessment Tax Assessment Total Assessment is a certain percentage of the fair market value that is determined by local assessors to be the total taxable value of land and additions on the property. | Land | Improvement |
|---|---|---|---|---|
| 2024 | $2,221 | $85,600 | $22,200 | $63,400 |
| 2023 | $2,076 | $85,600 | $22,200 | $63,400 |
| 2022 | $1,969 | $85,600 | $22,200 | $63,400 |
| 2021 | $1,986 | $85,600 | $22,200 | $63,400 |
| 2020 | $1,986 | $85,600 | $22,200 | $63,400 |
| 2019 | $1,935 | $85,600 | $22,200 | $63,400 |
| 2018 | $1,849 | $85,600 | $22,200 | $63,400 |
| 2017 | $1,849 | $85,600 | $22,200 | $63,400 |
| 2016 | $1,789 | $85,600 | $22,200 | $63,400 |
| 2015 | $1,806 | $85,600 | $22,200 | $63,400 |
| 2014 | $2,716 | $128,700 | $22,200 | $106,500 |
| 2013 | $2,677 | $128,700 | $22,200 | $106,500 |
Source: Public Records
Map
Nearby Homes