75 Main St Putnam, CT 06260
Estimated Value: $691,317
About This Home
This home is located at 75 Main St, Putnam, CT 06260 and is currently estimated at $691,317, approximately $50 per square foot. 75 Main St is a home located in Windham County with nearby schools including Putnam Elementary School, Putnam Middle School, and Putnam High School.
Ownership History
We collect this data history from publicly available records. To have your information removed, we recommend requesting removal directly through your county’s website.
Purchase Details
Home Financials for this Owner
Home Financials are based on the most recent Mortgage that was taken out on this home.Purchase Details
Home Values in the Area
Average Home Value in this Area
Purchase History
We collect this data history from publicly available records. To have your information removed, we recommend requesting removal directly through your county’s website.
| Date | Buyer | Sale Price | Title Company |
|---|---|---|---|
| $600,000 | -- | ||
| $600,000 | -- | ||
| $251,300 | -- | ||
| $251,300 | -- |
Mortgage History
We collect this data history from publicly available records. To have your information removed, we recommend requesting removal directly through your county’s website.
| Date | Status | Borrower | Loan Amount |
|---|---|---|---|
| Closed | $87,079 | ||
| Closed | $600,000 |
Tax History
We collect this data history from publicly available records. To have your information removed, we recommend requesting removal directly through your county’s website.
| Year | Tax Paid | Tax Assessment Tax Assessment Total Assessment is a certain percentage of the fair market value that is determined by local assessors to be the total taxable value of land and additions on the property. | Land | Improvement |
|---|---|---|---|---|
| 2025 | $12,916 | $509,500 | $41,600 | $467,900 |
| 2024 | $15,755 | $475,400 | $42,300 | $433,100 |
| 2023 | $15,250 | $479,700 | $42,300 | $437,400 |
| 2022 | $14,722 | $479,700 | $42,300 | $437,400 |
| 2021 | $14,314 | $479,700 | $42,300 | $437,400 |
| 2020 | $14,314 | $479,700 | $42,300 | $437,400 |
| 2019 | $20,319 | $641,800 | $59,200 | $582,600 |
| 2018 | $19,536 | $641,800 | $59,200 | $582,600 |
| 2017 | $18,869 | $641,800 | $59,200 | $582,600 |
| 2016 | $16,969 | $641,800 | $59,200 | $582,600 |
| 2015 | $20,473 | $792,900 | $59,200 | $733,700 |
| 2014 | -- | $588,280 | $59,200 | $529,080 |
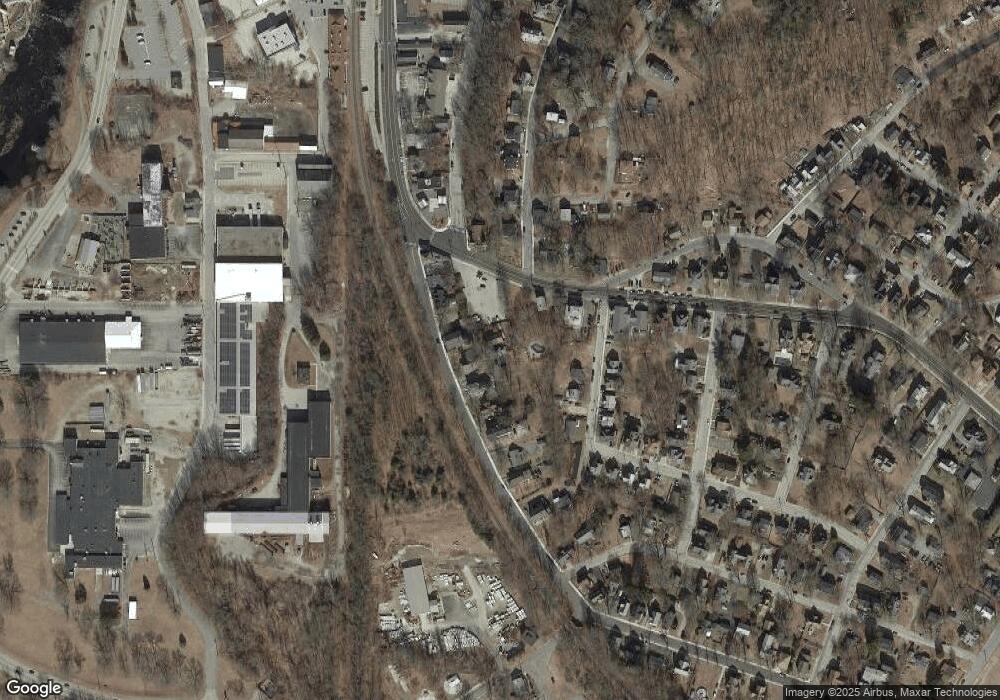
Map
- 67 Pomfret St
- 2 Lyon St Unit 12
- 46 Grove St
- 110 Church St
- 114 S Main St
- 25-27 Farrows St
- 7 Florence St
- 42 Fremont St
- 115 Grove St
- 29 Florence St
- 21-23 George St
- 176 S Main St
- 347-349 Kennedy Dr
- 62-64 Chapman St
- 236 Church St Unit 238
- 259 Church St
- 70 Walnut St
- 15 Milton St
- 129 Woodstock Ave
- 74 Perry St Unit 183
- 88 Main St
- 6 Pomfret St
- 6 Pomfret St Unit 14
- 8 Pomfret St
- 10 Pomfret St Unit 10
- 14 Pomfret St
- 6 Pomfret St
- 6 Pomfret St Unit 10
- 76 Main St
- 614 Pomfret St
- 12 Pomfret St
- 91 Main St
- 58 Main St
- 112 Main St
- 112 Main St Unit 14
- 112 Main St Unit 10
- 112 Main St Unit 4
- 112 Main St Unit 2
- 112 Main St Unit 7
- 112 Main St Unit 15
Ask me questions while you tour the home.