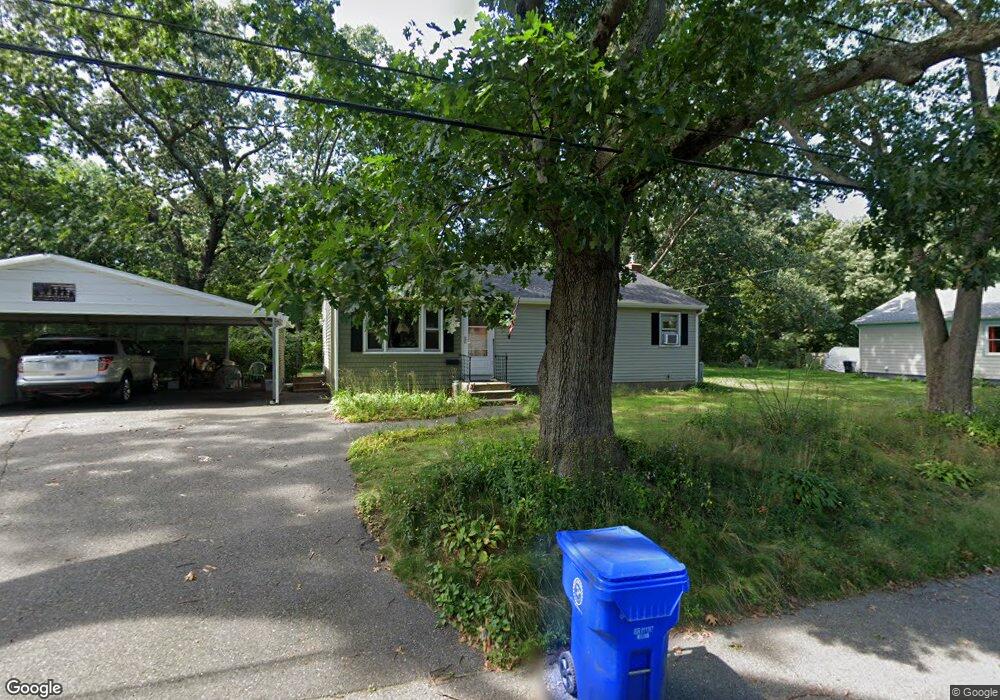
75 Main St Riverside, RI 02915
Riverside NeighborhoodEstimated Value: $428,559 - $474,000
3
Beds
2
Baths
1,296
Sq Ft
$349/Sq Ft
Est. Value
About This Home
This home is located at 75 Main St, Riverside, RI 02915 and is currently estimated at $452,140, approximately $348 per square foot. 75 Main St is a home located in Providence County with nearby schools including East Providence High School, St Mary Academy-Bay View, and St Luke Elementary School.
Ownership History
Date
Name
Owned For
Owner Type
Purchase Details
Closed on
Dec 4, 2019
Sold by
English Adria L
Bought by
Adria L English Ret and English
Current Estimated Value
Purchase Details
Closed on
May 14, 2019
Sold by
Brown F Irt and English
Bought by
English Adria L
Purchase Details
Closed on
May 23, 2011
Sold by
Brown George W and Brown Frances E
Bought by
Brown Ft and English
Create a Home Valuation Report for This Property
The Home Valuation Report is an in-depth analysis detailing your home's value as well as a comparison with similar homes in the area
Home Values in the Area
Average Home Value in this Area
Purchase History
| Date | Buyer | Sale Price | Title Company |
|---|---|---|---|
| Adria L English Ret | -- | None Available | |
| Adria L English Ret | -- | None Available | |
| English Adria L | -- | -- | |
| English Adria L | -- | -- | |
| English Adria L | -- | -- | |
| Brown Ft | -- | -- | |
| Brown Ft | -- | -- |
Source: Public Records
Tax History
| Year | Tax Paid | Tax Assessment Tax Assessment Total Assessment is a certain percentage of the fair market value that is determined by local assessors to be the total taxable value of land and additions on the property. | Land | Improvement |
|---|---|---|---|---|
| 2025 | $4,862 | $372,000 | $102,900 | $269,100 |
| 2024 | $4,723 | $308,100 | $85,700 | $222,400 |
| 2023 | $4,548 | $308,100 | $85,700 | $222,400 |
| 2022 | $4,114 | $188,200 | $48,500 | $139,700 |
| 2021 | $4,046 | $188,200 | $48,500 | $139,700 |
| 2020 | $3,875 | $188,200 | $48,500 | $139,700 |
| 2019 | $3,768 | $188,200 | $48,500 | $139,700 |
| 2018 | $3,725 | $162,800 | $52,100 | $110,700 |
| 2017 | $3,642 | $162,800 | $52,100 | $110,700 |
| 2016 | $3,624 | $162,800 | $52,100 | $110,700 |
| 2015 | $3,532 | $153,900 | $50,900 | $103,000 |
| 2014 | $3,532 | $153,900 | $50,900 | $103,000 |
Source: Public Records
Map
Nearby Homes
- 72 Stowe Ave
- 14 Winthrop St
- 33 Pine St Unit 35
- 103 Burnside Ave
- 41 White Ave
- 14 Benedict St
- 15 Claire St
- 25 Winslow St
- 10 Booth Ave
- 28 Jefferson Ave
- 129 Shore Rd
- 85 Hilton Ave
- 151 Willett Ave Unit 2
- 0 Carousel Dr
- 15 Plaza Dr
- 43 Bullocks Point Ave Unit 4A
- 916 Bullocks Pt Ave
- 25 Bullocks Point Ave Unit 5C
- 33 Bullocks Point Ave Unit 5C
- 23 Albert Ave
Your Personal Tour Guide
Ask me questions while you tour the home.