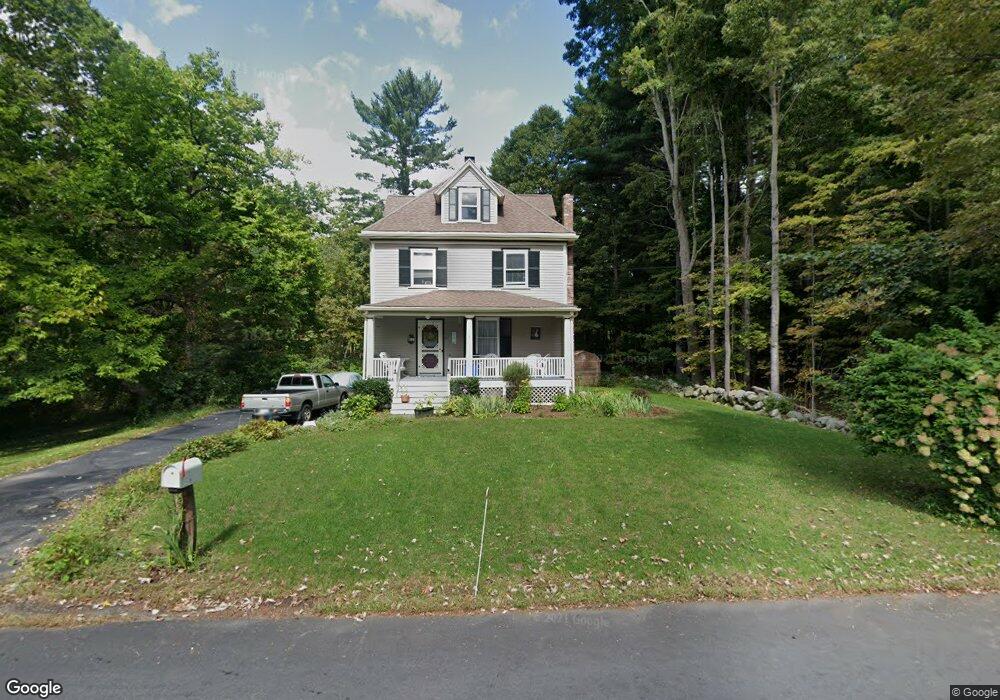
75 Mill St Reading, MA 01867
Estimated Value: $872,293 - $1,013,000
4
Beds
2
Baths
2,110
Sq Ft
$445/Sq Ft
Est. Value
About This Home
This home is located at 75 Mill St, Reading, MA 01867 and is currently estimated at $939,823, approximately $445 per square foot. 75 Mill St is a home located in Middlesex County with nearby schools including E Ethel Little School, North Reading Middle School, and North Reading High School.
Ownership History
Date
Name
Owned For
Owner Type
Purchase Details
Closed on
Dec 19, 2016
Sold by
Costigan John E and Baronian Janet
Bought by
Baronian-Costigan Lt and Costigan
Current Estimated Value
Purchase Details
Closed on
Jul 10, 1992
Sold by
Cummings Coles N and Cummings Robyn
Bought by
Baronian Janet and Costigan John E
Home Financials for this Owner
Home Financials are based on the most recent Mortgage that was taken out on this home.
Original Mortgage
$168,000
Interest Rate
8.56%
Mortgage Type
Purchase Money Mortgage
Purchase Details
Closed on
Aug 10, 1989
Sold by
Cronin Dennis P
Bought by
Coles N Anthony
Home Financials for this Owner
Home Financials are based on the most recent Mortgage that was taken out on this home.
Original Mortgage
$162,300
Interest Rate
9.93%
Mortgage Type
Purchase Money Mortgage
Create a Home Valuation Report for This Property
The Home Valuation Report is an in-depth analysis detailing your home's value as well as a comparison with similar homes in the area
Home Values in the Area
Average Home Value in this Area
Purchase History
| Date | Buyer | Sale Price | Title Company |
|---|---|---|---|
| Baronian-Costigan Lt | -- | -- | |
| Baronian Janet | $210,000 | -- | |
| Coles N Anthony | $216,500 | -- |
Source: Public Records
Mortgage History
| Date | Status | Borrower | Loan Amount |
|---|---|---|---|
| Previous Owner | Coles N Anthony | $170,000 | |
| Previous Owner | Coles N Anthony | $167,000 | |
| Previous Owner | Coles N Anthony | $168,000 | |
| Previous Owner | Coles N Anthony | $162,300 |
Source: Public Records
Tax History
| Year | Tax Paid | Tax Assessment Tax Assessment Total Assessment is a certain percentage of the fair market value that is determined by local assessors to be the total taxable value of land and additions on the property. | Land | Improvement |
|---|---|---|---|---|
| 2025 | $9,363 | $822,000 | $451,300 | $370,700 |
| 2024 | $9,254 | $789,600 | $433,500 | $356,100 |
| 2023 | $8,965 | $712,100 | $390,900 | $321,200 |
| 2022 | $8,631 | $647,500 | $355,400 | $292,100 |
| 2021 | $14,260 | $610,600 | $340,500 | $270,100 |
| 2020 | $5,503 | $581,100 | $324,000 | $257,100 |
| 2019 | $7,876 | $553,500 | $308,600 | $244,900 |
| 2018 | $7,242 | $522,100 | $291,100 | $231,000 |
| 2017 | $6,910 | $492,500 | $274,600 | $217,900 |
| 2016 | $6,223 | $429,200 | $246,000 | $183,200 |
| 2015 | $5,831 | $396,700 | $227,400 | $169,300 |
| 2014 | $5,650 | $383,300 | $219,700 | $163,600 |
Source: Public Records
Map
Nearby Homes
- 68 Sanborn Ln
- 42 Main St Unit 22
- 36 Main St Unit 1
- 28 Nutter Rd
- 32 Granger Ave
- 16 Briarwood Ave
- 11 Clover Cir Unit A
- 119 Van Norden Rd
- 43 Ashley Place
- 50 Forest St
- 10 Meadow Brook Ln
- 1 Greenbriar Dr Unit 303
- 2 Greenbriar Dr Unit 205
- 3 Greenbriar Dr Unit 106
- 3 Greenbriar Dr Unit 303
- 5 Greenbriar Dr Unit 107
- 0 Charles St Unit 72374573
- 114 Haverhill St
- 320 Martins Landing Unit 401
- 320 Martins Landing Unit 310
Your Personal Tour Guide
Ask me questions while you tour the home.