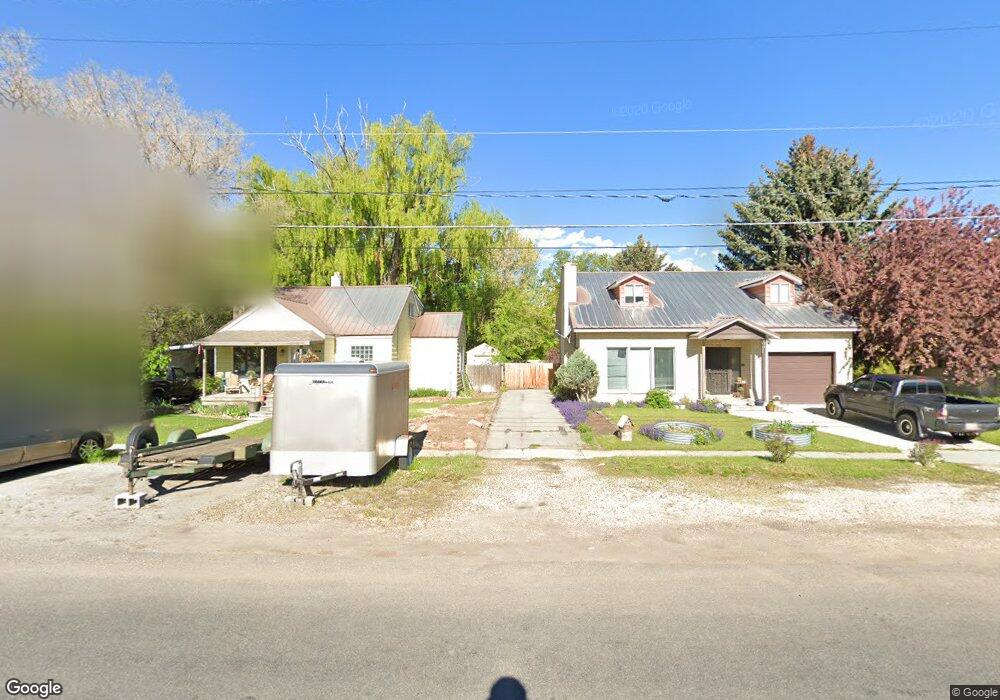
75 N 100 W Heber City, UT 84032
Estimated Value: $593,000 - $672,000
3
Beds
2
Baths
2,143
Sq Ft
$301/Sq Ft
Est. Value
About This Home
This home is located at 75 N 100 W, Heber City, UT 84032 and is currently estimated at $644,861, approximately $300 per square foot. 75 N 100 W is a home located in Wasatch County with nearby schools including Heber Valley Elementary School, Rocky Mountain Middle School, and Wasatch High School.
Ownership History
Date
Name
Owned For
Owner Type
Purchase Details
Closed on
Jul 13, 2012
Sold by
Eiting Merry Ashton
Bought by
Whittle John and Whittle Sally
Current Estimated Value
Home Financials for this Owner
Home Financials are based on the most recent Mortgage that was taken out on this home.
Original Mortgage
$202,300
Outstanding Balance
$139,513
Interest Rate
3.65%
Mortgage Type
New Conventional
Estimated Equity
$505,348
Purchase Details
Closed on
Jul 29, 2011
Sold by
Moulton Estates Llc
Bought by
Eiting Norman Elmer and Eiting Merry Ashton
Create a Home Valuation Report for This Property
The Home Valuation Report is an in-depth analysis detailing your home's value as well as a comparison with similar homes in the area
Home Values in the Area
Average Home Value in this Area
Purchase History
| Date | Buyer | Sale Price | Title Company |
|---|---|---|---|
| Whittle John | -- | Atlas Title Insurance Heber | |
| Eiting Norman Elmer | -- | Backman Ntp |
Source: Public Records
Mortgage History
| Date | Status | Borrower | Loan Amount |
|---|---|---|---|
| Open | Whittle John | $202,300 |
Source: Public Records
Tax History Compared to Growth
Tax History
| Year | Tax Paid | Tax Assessment Tax Assessment Total Assessment is a certain percentage of the fair market value that is determined by local assessors to be the total taxable value of land and additions on the property. | Land | Improvement |
|---|---|---|---|---|
| 2025 | $2,734 | $619,160 | $240,000 | $379,160 |
| 2024 | $2,734 | $537,280 | $240,000 | $297,280 |
| 2023 | $2,734 | $503,044 | $125,000 | $378,044 |
| 2022 | $2,799 | $503,044 | $125,000 | $378,044 |
| 2021 | $2,728 | $389,492 | $114,000 | $275,492 |
| 2020 | $2,579 | $358,468 | $125,000 | $233,468 |
| 2019 | $2,273 | $183,408 | $0 | $0 |
| 2018 | $1,823 | $147,161 | $0 | $0 |
| 2017 | $1,637 | $131,398 | $0 | $0 |
| 2016 | $1,681 | $131,398 | $0 | $0 |
| 2015 | $1,603 | $131,398 | $0 | $0 |
| 2014 | $1,479 | $120,115 | $0 | $0 |
Source: Public Records
Map
Nearby Homes