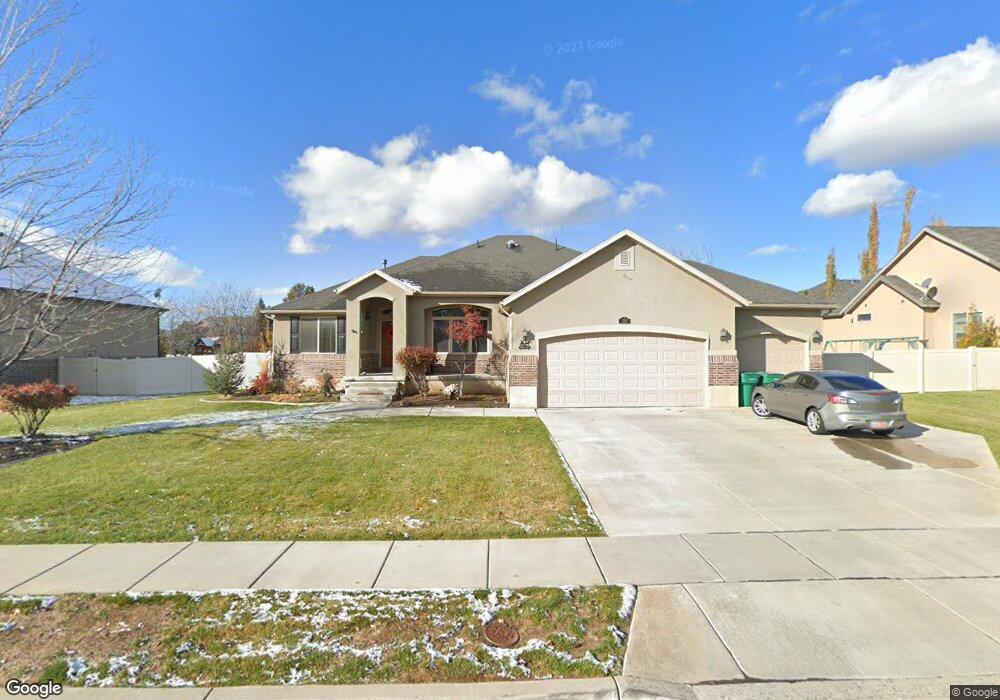
75 N 3300 W Layton, UT 84041
Estimated Value: $714,000 - $855,000
5
Beds
3
Baths
3,476
Sq Ft
$219/Sq Ft
Est. Value
About This Home
This home is located at 75 N 3300 W, Layton, UT 84041 and is currently estimated at $762,405, approximately $219 per square foot. 75 N 3300 W is a home located in Davis County with nearby schools including Sand Springs Elementary School, Legacy Junior High School, and Layton High School.
Ownership History
Date
Name
Owned For
Owner Type
Purchase Details
Closed on
Feb 26, 2024
Sold by
Behrens Robert G
Bought by
Durr Jeffrey and Durr Christy
Current Estimated Value
Home Financials for this Owner
Home Financials are based on the most recent Mortgage that was taken out on this home.
Original Mortgage
$550,000
Outstanding Balance
$540,371
Interest Rate
6.66%
Mortgage Type
Construction
Estimated Equity
$222,034
Purchase Details
Closed on
Oct 14, 2016
Sold by
Sellers Aaron J and Sellers Whitney A
Bought by
Behrens Robert G
Purchase Details
Closed on
Nov 20, 2008
Sold by
Destination Homes Inc
Bought by
Sellers Aaron J and Sellers Whitney A
Home Financials for this Owner
Home Financials are based on the most recent Mortgage that was taken out on this home.
Original Mortgage
$189,000
Interest Rate
5.9%
Mortgage Type
Purchase Money Mortgage
Purchase Details
Closed on
Jun 5, 2007
Sold by
Jmr Holdings Llc
Bought by
Destination Homes Inc
Home Financials for this Owner
Home Financials are based on the most recent Mortgage that was taken out on this home.
Original Mortgage
$292,500
Interest Rate
6.21%
Mortgage Type
Construction
Create a Home Valuation Report for This Property
The Home Valuation Report is an in-depth analysis detailing your home's value as well as a comparison with similar homes in the area
Home Values in the Area
Average Home Value in this Area
Purchase History
| Date | Buyer | Sale Price | Title Company |
|---|---|---|---|
| Durr Jeffrey | -- | Truly Title | |
| Behrens Robert G | -- | Northwest Title | |
| Sellers Aaron J | -- | Bonneville Superior Title | |
| Destination Homes Inc | -- | Heritage West Title Ins | |
| Jmr Holdings Llc | -- | Heritage West Title Ins |
Source: Public Records
Mortgage History
| Date | Status | Borrower | Loan Amount |
|---|---|---|---|
| Open | Durr Jeffrey | $550,000 | |
| Previous Owner | Sellers Aaron J | $189,000 | |
| Previous Owner | Jmr Holdings Llc | $292,500 |
Source: Public Records
Tax History
| Year | Tax Paid | Tax Assessment Tax Assessment Total Assessment is a certain percentage of the fair market value that is determined by local assessors to be the total taxable value of land and additions on the property. | Land | Improvement |
|---|---|---|---|---|
| 2025 | $3,521 | $369,601 | $137,055 | $232,546 |
| 2024 | $3,360 | $355,300 | $145,704 | $209,596 |
| 2023 | $3,262 | $608,000 | $156,235 | $451,765 |
| 2022 | $3,461 | $350,350 | $89,596 | $260,754 |
| 2021 | $3,200 | $483,000 | $134,364 | $348,636 |
| 2020 | $2,893 | $419,000 | $115,175 | $303,825 |
| 2019 | $2,806 | $398,000 | $112,946 | $285,054 |
| 2018 | $2,598 | $370,000 | $99,632 | $270,368 |
| 2016 | $2,538 | $186,450 | $41,842 | $144,608 |
| 2015 | $2,208 | $154,000 | $41,842 | $112,158 |
| 2014 | $2,019 | $143,972 | $41,842 | $102,130 |
| 2013 | -- | $160,095 | $41,383 | $118,712 |
Source: Public Records
Map
Nearby Homes
- 84 N 3225 W
- 245 S Summer Breeze Ln
- 34 S 3600 W
- 273 N 2975 W
- 3535 W Overlook Dr
- 2794 W Gentile St
- 2500 N North Fort Ln Unit 188
- 2350 N 720 W
- 3389 W Gordon Ave
- 306 S Sunburst Dr
- 263 S Sunburst Dr
- 2487 W Harmony Dr
- 818 N 2625 W
- 3506 S Kite St
- 3250 W 1075 N
- 2397 W Harmony Dr
- 3528 S Finch St
- 2480 S Main St
- 2987 S Old Emigrant Rd Unit A
- 3047 S Old Emigrant Rd
Your Personal Tour Guide
Ask me questions while you tour the home.