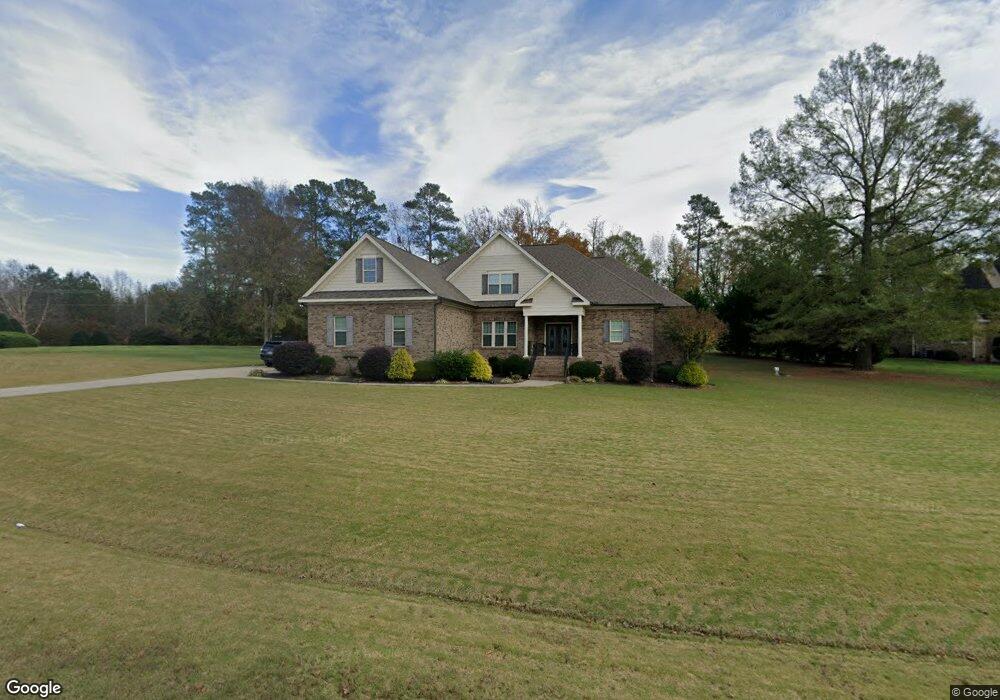
75 N Grande Overlook Dr Unit 1 Clayton, NC 27527
Estimated Value: $682,000 - $760,000
4
Beds
3
Baths
3,302
Sq Ft
$218/Sq Ft
Est. Value
About This Home
This home is located at 75 N Grande Overlook Dr Unit 1, Clayton, NC 27527 and is currently estimated at $721,227, approximately $218 per square foot. 75 N Grande Overlook Dr Unit 1 is a home located in Johnston County with nearby schools including Riverwood Elementary School, Riverwood Middle School, and Corinth Holders High School.
Ownership History
Date
Name
Owned For
Owner Type
Purchase Details
Closed on
Mar 22, 2021
Sold by
Shaw John Lester and Shaw Lorene Newman
Bought by
Premachandra Manosh and Premachandra Bernadine
Current Estimated Value
Home Financials for this Owner
Home Financials are based on the most recent Mortgage that was taken out on this home.
Original Mortgage
$510,860
Outstanding Balance
$458,722
Interest Rate
2.8%
Mortgage Type
New Conventional
Estimated Equity
$262,505
Purchase Details
Closed on
Nov 5, 2015
Sold by
Norwood Mary H and Heinsohn Ronald L
Bought by
Shan John Lester and Shan Lorene Newman
Home Financials for this Owner
Home Financials are based on the most recent Mortgage that was taken out on this home.
Original Mortgage
$315,000
Interest Rate
3.89%
Mortgage Type
Construction
Purchase Details
Closed on
Feb 5, 2010
Sold by
Marks Creek Developers Llc
Bought by
Norwood Mary N and Heinsohn Ronald H
Create a Home Valuation Report for This Property
The Home Valuation Report is an in-depth analysis detailing your home's value as well as a comparison with similar homes in the area
Home Values in the Area
Average Home Value in this Area
Purchase History
| Date | Buyer | Sale Price | Title Company |
|---|---|---|---|
| Premachandra Manosh | $561,000 | None Available | |
| Shan John Lester | $85,000 | None Available | |
| Norwood Mary N | -- | None Available |
Source: Public Records
Mortgage History
| Date | Status | Borrower | Loan Amount |
|---|---|---|---|
| Open | Premachandra Manosh | $510,860 | |
| Previous Owner | Shan John Lester | $315,000 |
Source: Public Records
Tax History Compared to Growth
Tax History
| Year | Tax Paid | Tax Assessment Tax Assessment Total Assessment is a certain percentage of the fair market value that is determined by local assessors to be the total taxable value of land and additions on the property. | Land | Improvement |
|---|---|---|---|---|
| 2025 | $4,808 | $757,230 | $150,000 | $607,230 |
| 2024 | $4,116 | $508,200 | $86,500 | $421,700 |
| 2023 | $4,116 | $508,200 | $86,500 | $421,700 |
| 2022 | $4,167 | $508,200 | $86,500 | $421,700 |
| 2021 | $4,081 | $497,740 | $86,500 | $411,240 |
| 2020 | $4,231 | $497,740 | $86,500 | $411,240 |
| 2019 | $4,231 | $497,740 | $86,500 | $411,240 |
| 2018 | $0 | $376,610 | $86,500 | $290,110 |
| 2017 | $3,201 | $376,610 | $86,500 | $290,110 |
| 2016 | $735 | $86,500 | $86,500 | $0 |
| 2014 | $735 | $86,500 | $86,500 | $0 |
Source: Public Records
Map
Nearby Homes
- 117 Landry Ct
- 224 Swann Trail
- 400 Charleston Dr
- 200 Mantle Dr
- 237 Boswell Ln
- 304 Nelson Ln
- 329 Chamberlain Dr
- 509 Sarazen Dr
- 320 Chamberlain Dr
- 524 Woodson Dr
- 209 Mccarthy Dr
- 629 Woodson Dr
- 605 Woodson Dr
- 700 Sarazen Dr
- 129 Haywood Ln
- 101 Houston Ln
- 245 E Webber Ln
- 109 E Webber Ln
- 147 Michael Way
- 113 Claire Dr
- 75 N Grande Overlook Dr
- 115 Grande Overlook Dr
- 27 Parque de Sarah Place
- 27 Parque de Sarah Place Unit Lt 21
- 34 Parque de Sarah Place
- 34 Parque de Sarah Ct
- 27 Parque de Sarah Ct
- 308 Elway Dr
- 149 Grande Overlook Dr
- 149 N Grande Overlook Dr
- 144 N Grande Overlook Dr
- 144 Grande Overlook Dr
- 61 Parque de Sarah Place
- 193 Grande Overlook Dr
- 90 Parque de Sarah Place
- 90 Parque de Sarah Place Unit 29
- 90 Parque de Sarah Place
- 32 Plaza de Luke Square
- 32 Plaza de Luke Square Unit 19
- 1007 Pritchard Rd