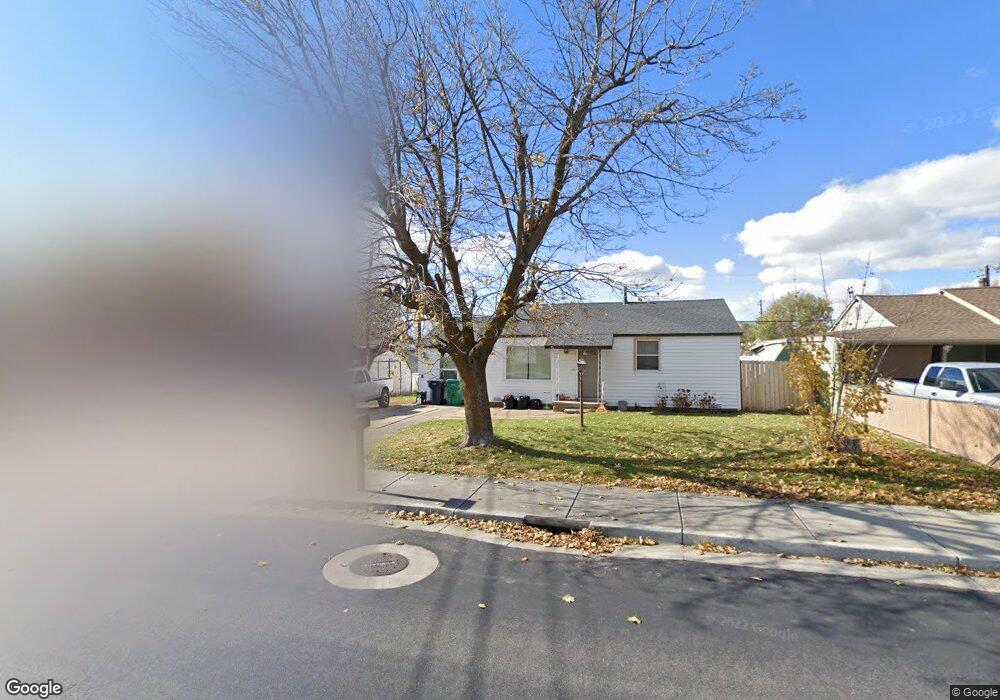
75 N Talbot Dr Layton, UT 84041
Estimated Value: $357,891 - $389,000
3
Beds
1
Bath
1,036
Sq Ft
$356/Sq Ft
Est. Value
About This Home
This home is located at 75 N Talbot Dr, Layton, UT 84041 and is currently estimated at $368,973, approximately $356 per square foot. 75 N Talbot Dr is a home located in Davis County with nearby schools including Whitesides Elementary School, Central Davis Junior High School, and Layton High School.
Ownership History
Date
Name
Owned For
Owner Type
Purchase Details
Closed on
Jun 4, 2012
Sold by
Curtis Joshua and Curtis Crystal N
Bought by
Clark Christopher J and Bosen Samantha Lyn
Current Estimated Value
Home Financials for this Owner
Home Financials are based on the most recent Mortgage that was taken out on this home.
Original Mortgage
$4,800
Interest Rate
4.05%
Mortgage Type
Stand Alone Second
Purchase Details
Closed on
Apr 19, 2012
Sold by
Curtis Joshua and Curtis Crystal N
Bought by
Clark Christopher J and Bosen Samantha Lyn
Home Financials for this Owner
Home Financials are based on the most recent Mortgage that was taken out on this home.
Original Mortgage
$4,800
Interest Rate
4.05%
Mortgage Type
Stand Alone Second
Purchase Details
Closed on
Oct 27, 2005
Sold by
Curtis Joshua
Bought by
Curtis Joshua and Curtis Crystal N
Home Financials for this Owner
Home Financials are based on the most recent Mortgage that was taken out on this home.
Original Mortgage
$73,350
Interest Rate
5.9%
Mortgage Type
Fannie Mae Freddie Mac
Create a Home Valuation Report for This Property
The Home Valuation Report is an in-depth analysis detailing your home's value as well as a comparison with similar homes in the area
Home Values in the Area
Average Home Value in this Area
Purchase History
| Date | Buyer | Sale Price | Title Company |
|---|---|---|---|
| Clark Christopher J | -- | Founders Title Co Lay | |
| Clark Christopher J | -- | Founders Title Co L | |
| Curtis Joshua | -- | Us Title Company Of Utah | |
| Curtis Joshua | -- | Security Title Of Davis Coun |
Source: Public Records
Mortgage History
| Date | Status | Borrower | Loan Amount |
|---|---|---|---|
| Previous Owner | Clark Christopher J | $4,800 | |
| Previous Owner | Curtis Joshua | $73,350 |
Source: Public Records
Tax History
| Year | Tax Paid | Tax Assessment Tax Assessment Total Assessment is a certain percentage of the fair market value that is determined by local assessors to be the total taxable value of land and additions on the property. | Land | Improvement |
|---|---|---|---|---|
| 2025 | $1,514 | $158,950 | $86,353 | $72,597 |
| 2024 | $1,493 | $157,850 | $101,219 | $56,631 |
| 2023 | $1,433 | $267,000 | $126,048 | $140,952 |
| 2022 | $1,413 | $143,000 | $64,923 | $78,077 |
| 2021 | $1,338 | $202,000 | $86,682 | $115,318 |
| 2020 | $1,208 | $175,000 | $74,759 | $100,241 |
| 2019 | $1,177 | $167,000 | $72,705 | $94,295 |
| 2018 | $1,046 | $149,000 | $72,705 | $76,295 |
| 2016 | $906 | $66,550 | $22,036 | $44,514 |
| 2015 | $858 | $59,840 | $22,036 | $37,804 |
| 2014 | $1,034 | $73,734 | $22,036 | $51,698 |
| 2013 | -- | $56,294 | $13,494 | $42,800 |
Source: Public Records
Map
Nearby Homes
- 187 N Talbot Dr
- 9 Colonial Ave
- 508 N Adamswood Rd
- 1137 Holmes Creek Ln
- 556 N Fairfield Rd Unit A2
- 556 N Fairfield Rd Unit D1
- 556 N Fairfield Rd Unit D2
- 556 N Fairfield Rd Unit A3
- 556 N Fairfield Rd Unit D3
- 556 N Fairfield Rd Unit D4
- 556 N Fairfield Rd Unit A1
- 556 N Fairfield Rd Unit A4
- 86 Mill Rd
- 149 N Fort Ln Unit 1D
- 861 E 575 N
- 479 N 1375 E
- 617 E 405 S
- 1515 E Gentile St
- 1368 E 275 S
- 1503 E 530 N
Your Personal Tour Guide
Ask me questions while you tour the home.