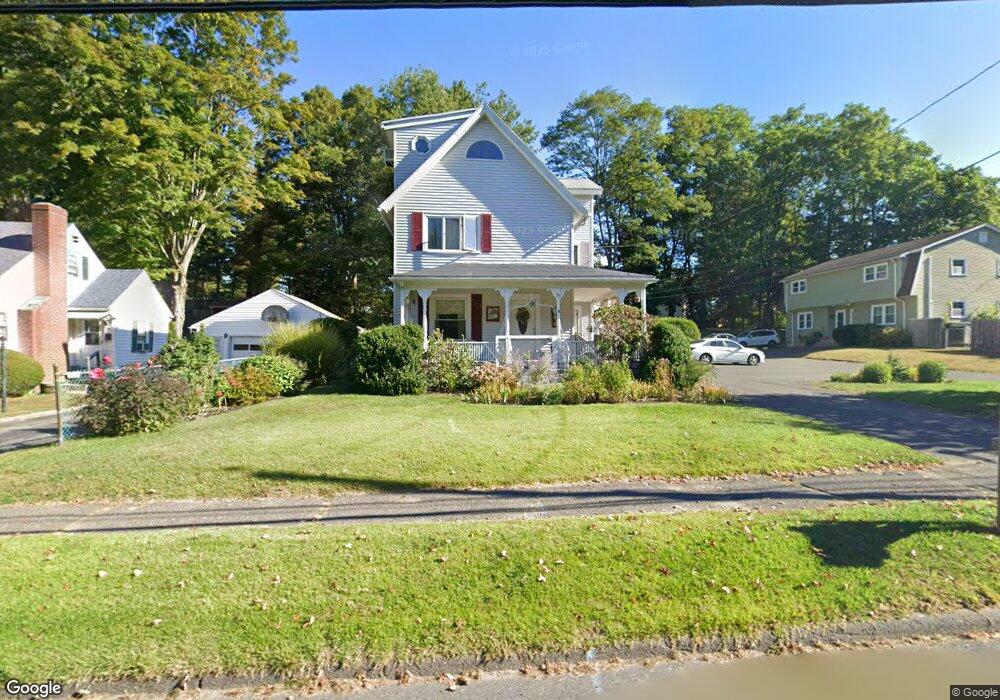
75 Nonotuck St Florence, MA 01062
Florence NeighborhoodEstimated Value: $553,000 - $855,000
3
Beds
3
Baths
2,210
Sq Ft
$303/Sq Ft
Est. Value
About This Home
This home is located at 75 Nonotuck St, Florence, MA 01062 and is currently estimated at $669,993, approximately $303 per square foot. 75 Nonotuck St is a home located in Hampshire County with nearby schools including Northampton High School, The Montessori School of Northampton, and Lander Grinspoon Academy.
Ownership History
Date
Name
Owned For
Owner Type
Purchase Details
Closed on
Jan 4, 2002
Sold by
Wisneski Joseph A
Bought by
Wade Lance
Current Estimated Value
Home Financials for this Owner
Home Financials are based on the most recent Mortgage that was taken out on this home.
Original Mortgage
$189,000
Interest Rate
6.72%
Mortgage Type
Purchase Money Mortgage
Create a Home Valuation Report for This Property
The Home Valuation Report is an in-depth analysis detailing your home's value as well as a comparison with similar homes in the area
Home Values in the Area
Average Home Value in this Area
Purchase History
We collect this data history from publicly available records. To have your information removed, we recommend requesting removal directly through your county’s website.
| Date | Buyer | Sale Price | Title Company |
|---|---|---|---|
| Wade Lance | $210,000 | -- |
Source: Public Records
Mortgage History
We collect this data history from publicly available records. To have your information removed, we recommend requesting removal directly through your county’s website.
| Date | Status | Borrower | Loan Amount |
|---|---|---|---|
| Open | Wade Lance | $158,000 | |
| Closed | Wade Lance | $185,000 | |
| Closed | Wade Lance | $189,000 | |
| Previous Owner | Wade Lance | $50,000 |
Source: Public Records
Tax History
| Year | Tax Paid | Tax Assessment Tax Assessment Total Assessment is a certain percentage of the fair market value that is determined by local assessors to be the total taxable value of land and additions on the property. | Land | Improvement |
|---|---|---|---|---|
| 2025 | $7,902 | $567,300 | $124,700 | $442,600 |
| 2024 | $8,087 | $532,400 | $124,700 | $407,700 |
| 2023 | $7,841 | $495,000 | $113,200 | $381,800 |
| 2022 | $6,906 | $386,000 | $113,200 | $272,800 |
| 2021 | $6,316 | $363,600 | $108,200 | $255,400 |
| 2020 | $6,108 | $363,600 | $108,200 | $255,400 |
| 2019 | $5,920 | $340,800 | $108,200 | $232,600 |
| 2018 | $5,874 | $344,700 | $108,200 | $236,500 |
| 2017 | $5,753 | $344,700 | $108,200 | $236,500 |
| 2016 | $5,570 | $344,700 | $108,200 | $236,500 |
| 2015 | $5,258 | $332,800 | $108,200 | $224,600 |
| 2014 | $5,122 | $332,800 | $108,200 | $224,600 |
Source: Public Records
Map
Nearby Homes
- 267 Locust St Unit 1A
- 60 Norwood Ave
- 14 Garfield St Unit A1
- 14 Garfield St Unit A2
- 76 Maple St
- 67 Milton St
- 41 N Main St
- 9 Khloe Ln
- 61 Woodlawn Ave
- 296 Elm St
- 60 Massasoit St
- 78 Forbes Ave
- 42 Clark St
- 15 Massasoit St
- 197 Bridge Rd
- 30 Birch Hill Rd
- 26 Crescent St Unit G2
- 155 Prospect St
- 142 Spruce Hill Ave
- 37 Finn St
Your Personal Tour Guide
Ask me questions while you tour the home.