Estimated Value: $394,000 - $470,000
2
Beds
--
Bath
1,040
Sq Ft
$406/Sq Ft
Est. Value
About This Home
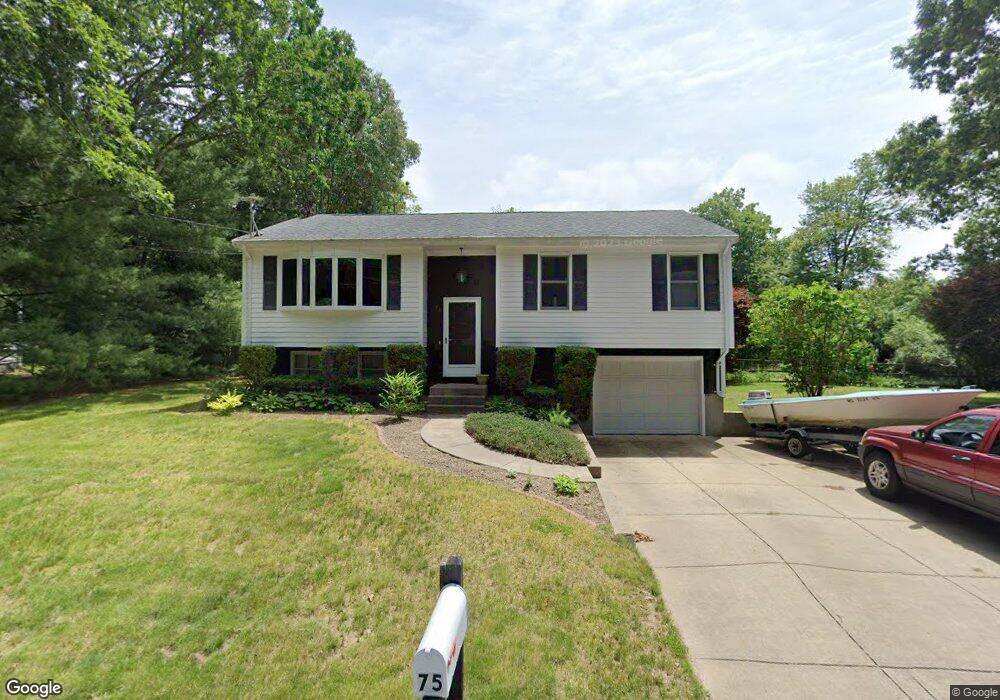
This home is located at 75 O Dr, Westport, MA 02790 and is currently estimated at $422,071, approximately $405 per square foot. 75 O Dr is a home located in Bristol County with nearby schools including Alice A. Macomber Primary School, Westport Elementary School, and Westport Middle-High School.
Ownership History
Date
Name
Owned For
Owner Type
Purchase Details
Closed on
Aug 18, 2016
Sold by
Soares Holly B
Bought by
Garside Michael D
Current Estimated Value
Purchase Details
Closed on
Sep 25, 2007
Sold by
Garside Michael D
Bought by
Garside T
Create a Home Valuation Report for This Property
The Home Valuation Report is an in-depth analysis detailing your home's value as well as a comparison with similar homes in the area
Home Values in the Area
Average Home Value in this Area
Purchase History
| Date | Buyer | Sale Price | Title Company |
|---|---|---|---|
| Garside Michael D | -- | -- | |
| Soares Holly B | -- | -- | |
| Garside T | -- | -- |
Source: Public Records
Mortgage History
| Date | Status | Borrower | Loan Amount |
|---|---|---|---|
| Previous Owner | Garside T | $67,000 | |
| Previous Owner | Garside T | $15,000 | |
| Previous Owner | Garside T | $19,000 |
Source: Public Records
Tax History Compared to Growth
Tax History
| Year | Tax Paid | Tax Assessment Tax Assessment Total Assessment is a certain percentage of the fair market value that is determined by local assessors to be the total taxable value of land and additions on the property. | Land | Improvement |
|---|---|---|---|---|
| 2025 | $2,342 | $314,300 | $159,500 | $154,800 |
| 2024 | $2,321 | $300,300 | $147,800 | $152,500 |
| 2023 | $2,199 | $269,500 | $134,600 | $134,900 |
| 2022 | $2,039 | $247,700 | $122,400 | $125,300 |
| 2021 | $2,039 | $236,600 | $111,300 | $125,300 |
| 2020 | $1,957 | $232,100 | $106,800 | $125,300 |
| 2019 | $1,857 | $224,600 | $106,800 | $117,800 |
| 2018 | $1,795 | $219,700 | $108,000 | $111,700 |
| 2017 | $1,659 | $208,200 | $104,500 | $103,700 |
| 2016 | $1,556 | $196,700 | $101,100 | $95,600 |
| 2015 | $1,607 | $202,700 | $103,400 | $99,300 |
Source: Public Records
Map
Nearby Homes