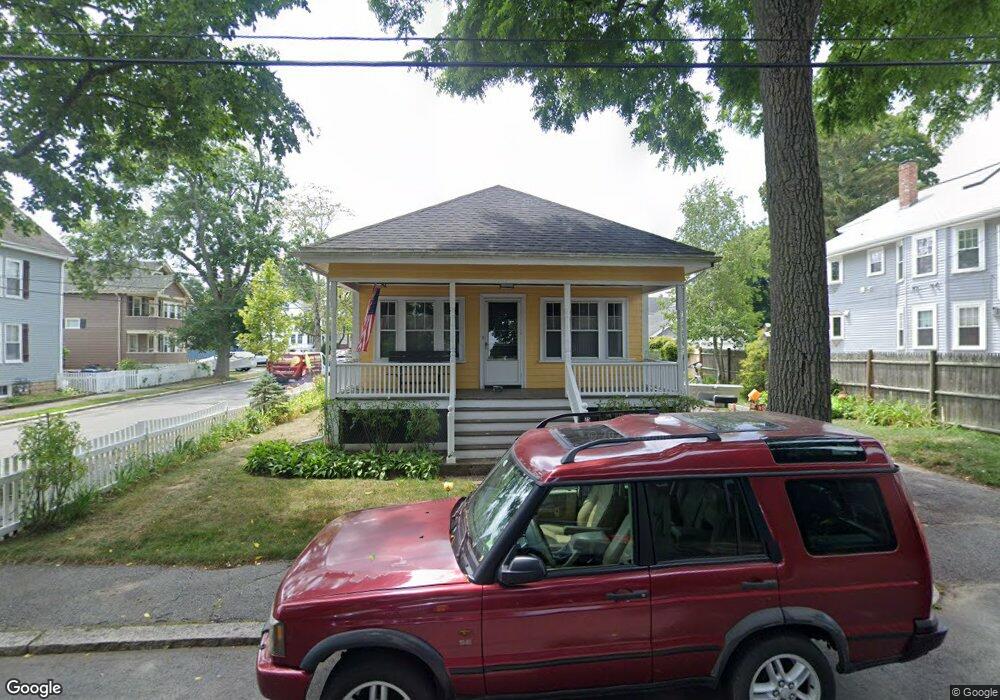
75 Orchard St Salem, MA 01970
North Salem NeighborhoodEstimated Value: $619,000 - $713,000
3
Beds
1
Bath
1,192
Sq Ft
$549/Sq Ft
Est. Value
About This Home
This home is located at 75 Orchard St, Salem, MA 01970 and is currently estimated at $654,852, approximately $549 per square foot. 75 Orchard St is a home located in Essex County with nearby schools including Bates Elementary School, Saltonstall School, and Carlton Elementary School.
Ownership History
Date
Name
Owned For
Owner Type
Purchase Details
Closed on
Dec 13, 2011
Sold by
Collins David J
Bought by
Collins David J and Stebbins Jessica R
Current Estimated Value
Home Financials for this Owner
Home Financials are based on the most recent Mortgage that was taken out on this home.
Original Mortgage
$225,000
Outstanding Balance
$158,117
Interest Rate
4.09%
Estimated Equity
$496,735
Purchase Details
Closed on
Jun 26, 2003
Sold by
James Norma B
Bought by
Collins David J
Home Financials for this Owner
Home Financials are based on the most recent Mortgage that was taken out on this home.
Original Mortgage
$225,000
Interest Rate
5.53%
Mortgage Type
Purchase Money Mortgage
Create a Home Valuation Report for This Property
The Home Valuation Report is an in-depth analysis detailing your home's value as well as a comparison with similar homes in the area
Home Values in the Area
Average Home Value in this Area
Purchase History
| Date | Buyer | Sale Price | Title Company |
|---|---|---|---|
| Collins David J | -- | -- | |
| Collins David J | $325,000 | -- |
Source: Public Records
Mortgage History
| Date | Status | Borrower | Loan Amount |
|---|---|---|---|
| Open | Collins David J | $225,000 | |
| Previous Owner | Collins David J | $225,000 |
Source: Public Records
Tax History
| Year | Tax Paid | Tax Assessment Tax Assessment Total Assessment is a certain percentage of the fair market value that is determined by local assessors to be the total taxable value of land and additions on the property. | Land | Improvement |
|---|---|---|---|---|
| 2025 | $6,283 | $554,100 | $210,600 | $343,500 |
| 2024 | $6,111 | $525,900 | $200,100 | $325,800 |
| 2023 | $5,902 | $471,800 | $184,700 | $287,100 |
| 2022 | $5,631 | $425,000 | $178,600 | $246,400 |
| 2021 | $5,376 | $389,600 | $166,300 | $223,300 |
| 2020 | $5,159 | $357,000 | $157,000 | $200,000 |
| 2019 | $5,042 | $333,900 | $149,000 | $184,900 |
| 2018 | $5,022 | $326,500 | $141,600 | $184,900 |
| 2017 | $4,828 | $304,400 | $119,500 | $184,900 |
| 2016 | $4,682 | $298,800 | $113,900 | $184,900 |
| 2015 | $4,569 | $278,400 | $104,700 | $173,700 |
Source: Public Records
Map
Nearby Homes
- 44 Orne St Unit 44
- 21 Manning St
- 41 Dearborn St
- 27 Appleton St
- 40 Buffum St Unit 2
- 40 Buffum St Unit 1
- 112 North St
- 16 Franklin St Unit 2403
- 16 Franklin St Unit 1303
- 3 S Mason St
- 16 Oakland St
- 156 Bridge St Unit B
- 85 Bridge St Unit 4
- 16 River St
- 9 Highland St
- 14 Mall St Unit B
- 17 North St Unit 2
- 65 Washington St Unit 512
- 16 Williams St
- 11 Williams St Unit 2
- 77 Orchard St
- 77 Orchard St Unit 2
- 71 Orchard St
- 71 Orchard St Unit 1
- 71 Orchard St Unit 2
- 73 Orchard St Unit 2
- 6 Manning St
- 78 Orchard St Unit 80
- 81 Orchard St Unit 2
- 81 Orchard St Unit 1
- 5 Manning St
- 5 Manning St Unit 2
- 10 Manning St
- 69 Orchard St
- 86 Orchard St
- 91 Orchard St
- 9 Manning St
- 72 Orchard St
- 14 Manning St
- 88 Orchard St