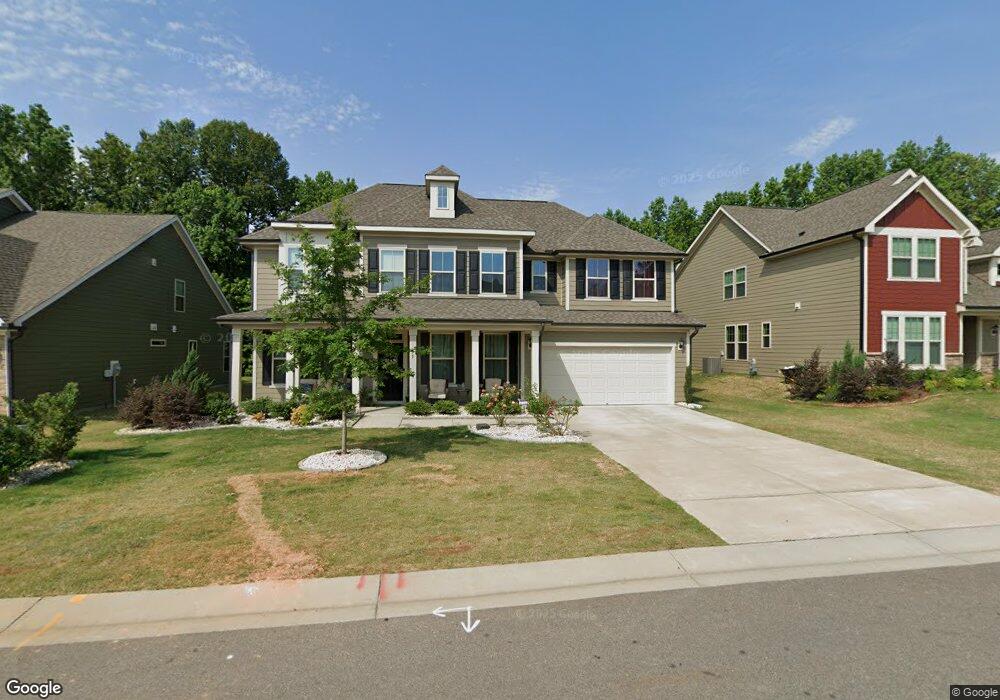
75 Pearsall Farm Ln Unit Lot 00.0032 Clayton, NC 27527
Wilders NeighborhoodEstimated Value: $543,000 - $570,000
5
Beds
4
Baths
3,364
Sq Ft
$165/Sq Ft
Est. Value
About This Home
This home is located at 75 Pearsall Farm Ln Unit Lot 00.0032, Clayton, NC 27527 and is currently estimated at $553,957, approximately $164 per square foot. 75 Pearsall Farm Ln Unit Lot 00.0032 is a home located in Johnston County with nearby schools including River Dell Elementary School, Archer Lodge Middle School, and Corinth Holders High School.
Ownership History
Date
Name
Owned For
Owner Type
Purchase Details
Closed on
Mar 3, 2025
Sold by
Stockton Mark and Stockton Kerry
Bought by
Seyedali Hosseinirad and Seyedali Fereshteh Shahoveisi
Current Estimated Value
Home Financials for this Owner
Home Financials are based on the most recent Mortgage that was taken out on this home.
Original Mortgage
$449,200
Outstanding Balance
$446,976
Interest Rate
7.04%
Mortgage Type
New Conventional
Estimated Equity
$106,981
Purchase Details
Closed on
Aug 4, 2020
Sold by
Argueta William A and Argueta Josephine M
Bought by
Stockton Mark
Home Financials for this Owner
Home Financials are based on the most recent Mortgage that was taken out on this home.
Original Mortgage
$324,000
Interest Rate
3.1%
Mortgage Type
New Conventional
Purchase Details
Closed on
Jan 27, 2017
Sold by
Dan Ryan Builders
Bought by
Argueta William A and Argueta Josephine M
Create a Home Valuation Report for This Property
The Home Valuation Report is an in-depth analysis detailing your home's value as well as a comparison with similar homes in the area
Home Values in the Area
Average Home Value in this Area
Purchase History
| Date | Buyer | Sale Price | Title Company |
|---|---|---|---|
| Seyedali Hosseinirad | $560,000 | Chicago Title | |
| Stockton Mark | $360,000 | None Available | |
| Argueta William A | $335,500 | -- |
Source: Public Records
Mortgage History
| Date | Status | Borrower | Loan Amount |
|---|---|---|---|
| Open | Seyedali Hosseinirad | $449,200 | |
| Previous Owner | Stockton Mark | $324,000 |
Source: Public Records
Tax History Compared to Growth
Tax History
| Year | Tax Paid | Tax Assessment Tax Assessment Total Assessment is a certain percentage of the fair market value that is determined by local assessors to be the total taxable value of land and additions on the property. | Land | Improvement |
|---|---|---|---|---|
| 2025 | $3,391 | $534,090 | $65,000 | $469,090 |
| 2024 | $2,795 | $345,060 | $52,500 | $292,560 |
| 2023 | $2,795 | $345,060 | $52,500 | $292,560 |
| 2022 | $2,829 | $345,060 | $52,500 | $292,560 |
| 2021 | $2,829 | $345,060 | $52,500 | $292,560 |
| 2020 | $2,933 | $345,060 | $52,500 | $292,560 |
| 2019 | $2,933 | $345,060 | $52,500 | $292,560 |
| 2018 | $2,904 | $333,740 | $40,000 | $293,740 |
| 2017 | $2,837 | $333,740 | $40,000 | $293,740 |
Source: Public Records
Map
Nearby Homes
- 366 Bramble Ln
- 112 River Dell Townes Ave
- 303 Norwood Dr
- 67 Blue Spruce Cir
- 59 Blue Spruce Cir
- 537 Bramble Ln
- 161 Albemarle Dr
- 65 Balsam Ln
- 210 Alnwick Ct
- 107 Thornbury St
- 80 Bramble Ln
- 362 Beckwith Ave
- 46 S Great White Way
- 346 E Painted Way
- 80 Willow Green Dr
- 202 E Painted Way
- 67 Little Leaf Ln Unit 98
- 225 Beckwith Ave
- 71 Little Leaf Ln Unit 99
- 90 W Grove Point Dr
- 61 Pearsall Farm Ln Unit Lot 00.0031
- 87 Pearsall Farm Ln Unit Lot 00.0033
- 87 Pearsall Farm Ln
- 87 Pearsall Farm Ln Unit Lot 00.0033
- 61 Pearsall Farm Ln Unit Lot 00.0031
- 61 Pearsall Farm Ln
- 49 Pearsall Farm Ln
- 49 Pearsall Farm Ln Unit 30
- 99 Pearsall Farm Ln Unit Lot 00.0034
- 99 Pearsall Farm Ln
- 99 Pearsall Farm Ln Unit Lot 00.0034
- 99 Pearsall Farm Ln
- 66 Pearsall Farm Ln
- 80 Pearsall Farm Ln Unit lot 00.0040
- 80 Pearsall Farm Ln Unit lot 00.0040
- 80 Pearsall Farm Ln
- 66 Pearsall Farm Ln
- 94 Pearsall Farm Ln Unit Lot 00.0039
- 94 Pearsall Farm Ln
- 37 Pearsall Farm Ln Unit lot 00.0029