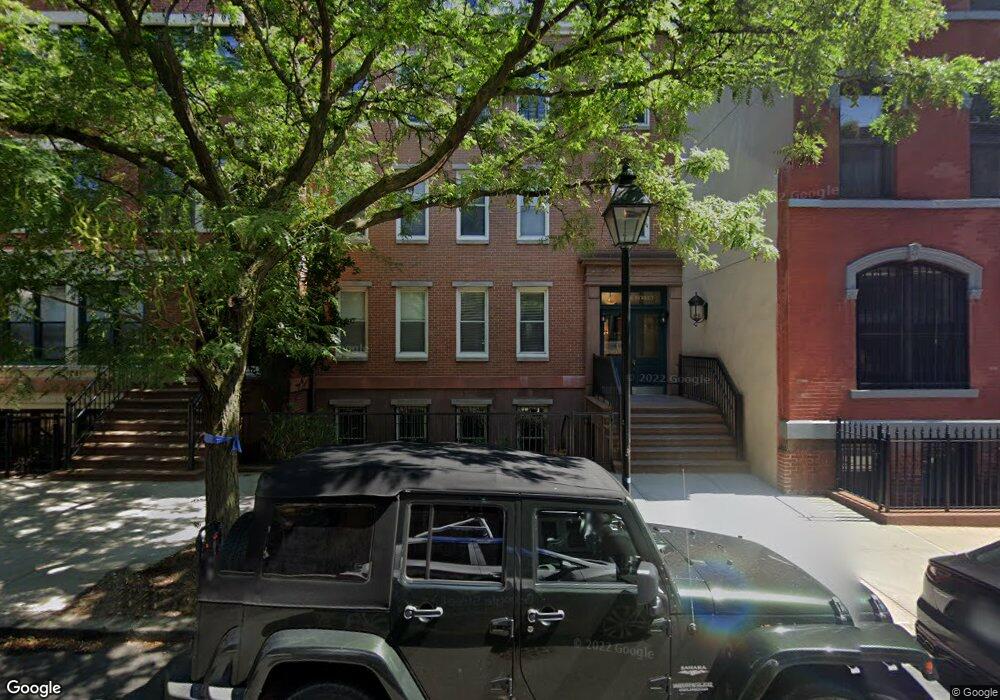
Bridge Harbor Heights Condominium 75 Poplar St Unit GC Brooklyn, NY 11201
Brooklyn Heights NeighborhoodEstimated Value: $1,158,434 - $1,798,000
--
Bed
--
Bath
1,000
Sq Ft
$1,524/Sq Ft
Est. Value
About This Home
This home is located at 75 Poplar St Unit GC, Brooklyn, NY 11201 and is currently estimated at $1,524,359, approximately $1,524 per square foot. 75 Poplar St Unit GC is a home located in Kings County with nearby schools including P.S. 8 Robert Fulton, Explore Schools, and Guidepost Montessori at Brooklyn Heights.
Ownership History
Date
Name
Owned For
Owner Type
Purchase Details
Closed on
Oct 27, 2004
Sold by
Darby Jennifer
Bought by
Rajguru Manish and Rajguru Marilyn
Current Estimated Value
Home Financials for this Owner
Home Financials are based on the most recent Mortgage that was taken out on this home.
Original Mortgage
$72,000
Outstanding Balance
$35,859
Interest Rate
5.75%
Estimated Equity
$1,488,500
Purchase Details
Closed on
Aug 16, 2004
Sold by
Darby David and Darby Jennifer
Bought by
Darby Jennifer
Purchase Details
Closed on
Feb 26, 1999
Sold by
Darby David
Bought by
Darby David and Darby Jennifer
Purchase Details
Closed on
Jul 13, 1998
Sold by
Lambert Martin David
Bought by
Darby David and Matulewicz Jennifer
Home Financials for this Owner
Home Financials are based on the most recent Mortgage that was taken out on this home.
Original Mortgage
$261,600
Interest Rate
6.89%
Create a Home Valuation Report for This Property
The Home Valuation Report is an in-depth analysis detailing your home's value as well as a comparison with similar homes in the area
Home Values in the Area
Average Home Value in this Area
Purchase History
| Date | Buyer | Sale Price | Title Company |
|---|---|---|---|
| Rajguru Manish | $720,000 | -- | |
| Rajguru Manish | $720,000 | -- | |
| Darby Jennifer | $287,000 | -- | |
| Darby Jennifer | $287,000 | -- | |
| Darby David | -- | Lawyers Title Insurance Corp | |
| Darby David | -- | Lawyers Title Insurance Corp | |
| Darby David | $327,500 | -- | |
| Darby David | $327,500 | -- |
Source: Public Records
Mortgage History
| Date | Status | Borrower | Loan Amount |
|---|---|---|---|
| Open | Rajguru Manish | $72,000 | |
| Closed | Rajguru Manish | $72,000 | |
| Open | Rajguru Manish | $576,000 | |
| Closed | Rajguru Manish | $576,000 | |
| Previous Owner | Darby David | $261,600 |
Source: Public Records
Tax History Compared to Growth
Tax History
| Year | Tax Paid | Tax Assessment Tax Assessment Total Assessment is a certain percentage of the fair market value that is determined by local assessors to be the total taxable value of land and additions on the property. | Land | Improvement |
|---|---|---|---|---|
| 2025 | $14,314 | $117,518 | $16,825 | $100,693 |
| 2024 | $14,314 | $121,736 | $16,825 | $104,911 |
| 2023 | $11,448 | $131,575 | $16,825 | $114,750 |
| 2022 | $10,728 | $114,460 | $16,825 | $97,635 |
| 2021 | $10,161 | $101,028 | $16,825 | $84,203 |
| 2020 | $4,730 | $111,921 | $16,825 | $95,096 |
| 2019 | $9,190 | $106,641 | $16,825 | $89,816 |
| 2018 | $10,294 | $97,362 | $16,825 | $80,537 |
| 2017 | $9,618 | $93,923 | $16,825 | $77,098 |
| 2016 | $9,225 | $74,366 | $16,825 | $57,541 |
| 2015 | $5,473 | $78,170 | $16,825 | $61,345 |
| 2014 | $5,473 | $69,716 | $16,825 | $52,891 |
Source: Public Records
About Bridge Harbor Heights Condominium
Map
Nearby Homes
- 55 Poplar St Unit 6B
- 55 Poplar St Unit 2C
- 20 Henry St Unit PH3/S
- 20 Henry St Unit 1B/N
- 20 Henry St Unit 5D/S
- 25 Middagh St
- 55 Hicks St Unit 1
- 55 Hicks St Unit 2
- 55 Hicks St Unit 3
- 60 Hicks St
- 24 Middagh St
- 30 Front St Unit 18C
- 30 Front St Unit 28 C
- 30 Front St Unit 28 B
- 30 Front St Unit 18 D
- 30 Front St Unit 10B
- 30 Front St Unit 22D
- 30 Front St Unit 19 B
- 30 Front St Unit 15 A
- 30 Front St Unit 23 B
- 75 Poplar St Unit 7E
- 75 Poplar St Unit 25F
- 75 Poplar St Unit 81P
- 75 Poplar St Unit 3I
- 75 Poplar St Unit 2L
- 75 Poplar St Unit 1L
- 75 Poplar St Unit 1K
- 75 Poplar St Unit 1J
- 75 Poplar St Unit 2D
- 75 Poplar St Unit GM
- 75 Poplar St Unit 77P
- 75 Poplar St Unit 5F
- 75 Poplar St Unit 4M
- 75 Poplar St Unit 3F
- 75 Poplar St Unit 2F
- 75 Poplar St Unit 5B
- 75 Poplar St Unit 5A
- 75 Poplar St Unit 3D
- 75 Poplar St Unit GE
- 75 Poplar St Unit GL