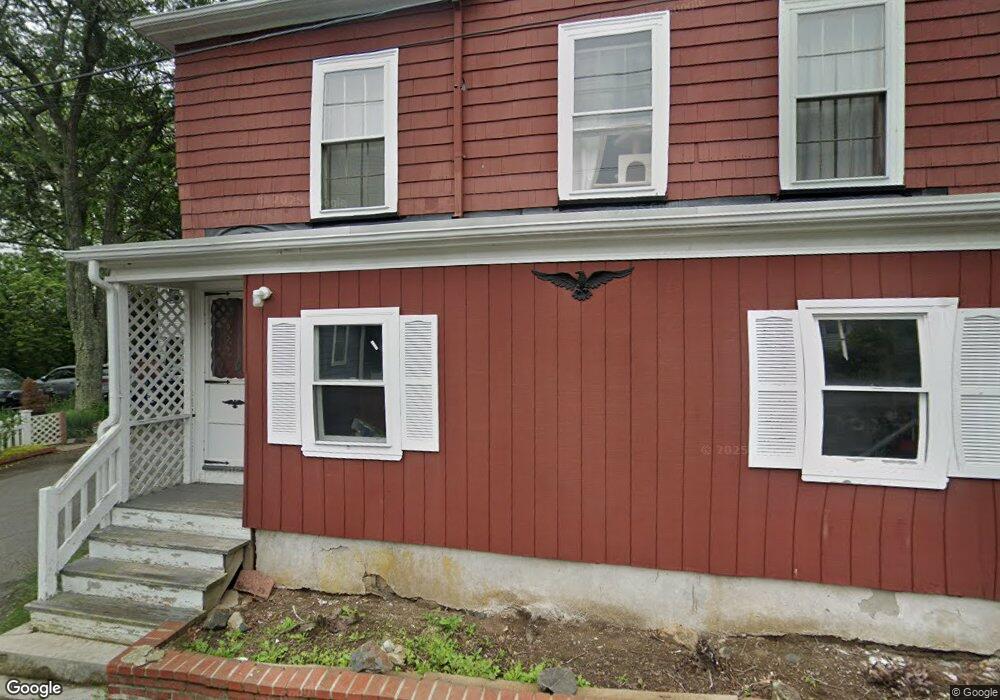
75 Roy St Swampscott, MA 01907
Estimated Value: $620,000 - $654,000
3
Beds
2
Baths
1,380
Sq Ft
$461/Sq Ft
Est. Value
About This Home
This home is located at 75 Roy St, Swampscott, MA 01907 and is currently estimated at $635,535, approximately $460 per square foot. 75 Roy St is a home located in Essex County with nearby schools including Swampscott Middle School and Swampscott High School.
Ownership History
Date
Name
Owned For
Owner Type
Purchase Details
Closed on
Jun 30, 2017
Sold by
Janakas Joanne and Janakas Christopher
Bought by
Yu Robert J and Yu Angie H
Current Estimated Value
Home Financials for this Owner
Home Financials are based on the most recent Mortgage that was taken out on this home.
Original Mortgage
$256,000
Outstanding Balance
$212,427
Interest Rate
4.02%
Mortgage Type
New Conventional
Estimated Equity
$423,108
Create a Home Valuation Report for This Property
The Home Valuation Report is an in-depth analysis detailing your home's value as well as a comparison with similar homes in the area
Home Values in the Area
Average Home Value in this Area
Purchase History
| Date | Buyer | Sale Price | Title Company |
|---|---|---|---|
| Yu Robert J | $320,000 | -- | |
| Yu Robert J | $320,000 | -- |
Source: Public Records
Mortgage History
| Date | Status | Borrower | Loan Amount |
|---|---|---|---|
| Open | Yu Robert J | $256,000 | |
| Closed | Yu Robert J | $256,000 |
Source: Public Records
Tax History
| Year | Tax Paid | Tax Assessment Tax Assessment Total Assessment is a certain percentage of the fair market value that is determined by local assessors to be the total taxable value of land and additions on the property. | Land | Improvement |
|---|---|---|---|---|
| 2025 | $6,945 | $605,500 | $216,500 | $389,000 |
| 2024 | $6,752 | $587,600 | $206,200 | $381,400 |
| 2023 | $6,288 | $535,600 | $190,900 | $344,700 |
| 2022 | $5,884 | $458,600 | $168,000 | $290,600 |
| 2021 | $5,724 | $414,800 | $129,800 | $285,000 |
| 2020 | $5,770 | $403,500 | $122,200 | $281,300 |
| 2019 | $5,901 | $388,200 | $106,900 | $281,300 |
| 2018 | $5,056 | $316,000 | $106,900 | $209,100 |
| 2017 | $4,944 | $283,300 | $91,700 | $191,600 |
| 2016 | $4,579 | $264,200 | $72,600 | $191,600 |
| 2015 | $4,531 | $264,200 | $72,600 | $191,600 |
| 2014 | $4,307 | $230,300 | $51,900 | $178,400 |
Source: Public Records
Map
Nearby Homes
- 60 Roy St
- 40 Buena Vista St
- 40 Archer St
- 59 Essex St Unit 59B
- 21 E Park Ave
- 80 Norfolk Ave Unit 1
- 106 Norfolk Ave
- 44 Valley Rd
- 64 Stetson Ave
- 129 Marianna St
- 91 Oakwood Ave
- 30 Clifton Ave
- 146 Burrill St
- 178 Norfolk Ave
- 16 Clinton St
- 11 Boynton St Unit 104
- 11 Boynton St Unit 101
- 11 Boynton St Unit 102
- 11 Boynton St Unit 103
- 11 Boynton St Unit 204
Your Personal Tour Guide
Ask me questions while you tour the home.