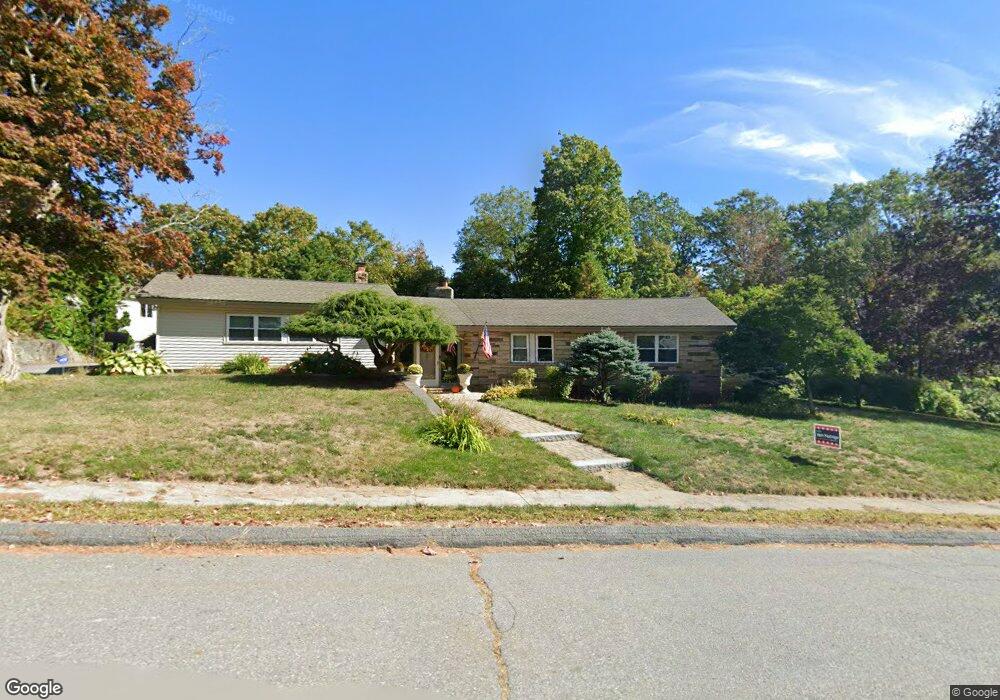
75 Ryefield Rd Fitchburg, MA 01420
Estimated Value: $491,000 - $544,000
4
Beds
3
Baths
1,939
Sq Ft
$266/Sq Ft
Est. Value
About This Home
This home is located at 75 Ryefield Rd, Fitchburg, MA 01420 and is currently estimated at $515,439, approximately $265 per square foot. 75 Ryefield Rd is a home located in Worcester County with nearby schools including Crocker Elementary School, South Street Elementary School, and Fitchburg High School.
Ownership History
Date
Name
Owned For
Owner Type
Purchase Details
Closed on
Apr 1, 2024
Sold by
Capodagli Peter G and Capodagli Ann M
Bought by
Anna M Capodagli T M and Anna Capodagli
Current Estimated Value
Purchase Details
Closed on
Jun 14, 1986
Bought by
Capodagli Peter and Capodagli Ann M
Create a Home Valuation Report for This Property
The Home Valuation Report is an in-depth analysis detailing your home's value as well as a comparison with similar homes in the area
Purchase History
| Date | Buyer | Sale Price | Title Company |
|---|---|---|---|
| Anna M Capodagli T M | -- | None Available | |
| Capodagli Peter | $95,000 | -- |
Source: Public Records
Mortgage History
| Date | Status | Borrower | Loan Amount |
|---|---|---|---|
| Previous Owner | Capodagli Peter | $50,000 | |
| Previous Owner | Capodagli Peter | $127,500 | |
| Previous Owner | Capodagli Peter | $125,000 |
Source: Public Records
Tax History
| Year | Tax Paid | Tax Assessment Tax Assessment Total Assessment is a certain percentage of the fair market value that is determined by local assessors to be the total taxable value of land and additions on the property. | Land | Improvement |
|---|---|---|---|---|
| 2025 | $67 | $498,600 | $114,300 | $384,300 |
| 2024 | $6,436 | $434,600 | $96,100 | $338,500 |
| 2023 | $6,413 | $400,300 | $85,600 | $314,700 |
| 2022 | $6,674 | $379,000 | $87,000 | $292,000 |
| 2021 | $6,942 | $364,800 | $84,000 | $280,800 |
| 2020 | $6,871 | $348,600 | $82,500 | $266,100 |
| 2019 | $3,288 | $314,100 | $83,900 | $230,200 |
| 2018 | $6,120 | $291,300 | $77,900 | $213,400 |
| 2017 | $5,944 | $276,600 | $76,400 | $200,200 |
| 2016 | $5,656 | $266,400 | $70,400 | $196,000 |
| 2015 | $5,412 | $261,700 | $67,400 | $194,300 |
| 2014 | $5,190 | $261,700 | $67,400 | $194,300 |
Source: Public Records
Map
Nearby Homes
- 233 Mount Vernon St
- 164 Blossom St
- 33 Pearl St
- 58 Marshall St
- 13 Berkley St
- 875 John Fitch Hwy Unit 47
- 0 Marshall St L1
- 0 Marshall St L2
- 102 Pleasant St
- 154 Pleasant St
- 151 Mechanic St
- 58 Oliver St
- 24 Berkshire St
- 80 Highland Ave
- 44-46 Oliver St
- 62 Grove St
- 58 (A B) Oliver St
- 120 Rinnock Rd
- 74 East St
- 12 Prince St
- 380 Blossom St
- 360 Blossom St
- 45 Ryefield Rd
- 91 Ryefield Rd
- 64 Ryefield Rd
- 390 Blossom St
- 84 Ryefield Rd
- 406 Blossom St
- 44 Ryefield Rd
- 381 Blossom St
- 367 Blossom St
- 383 Blossom St Unit 387
- 395 Blossom St
- 100 Ryefield Rd
- 353 Blossom St
- 338 Blossom St
- 338 Blossom St Unit 3
- 338 Blossom St Unit 2
- 338 Blossom St Unit 1
- 265 Mount Vernon St
Your Personal Tour Guide
Ask me questions while you tour the home.