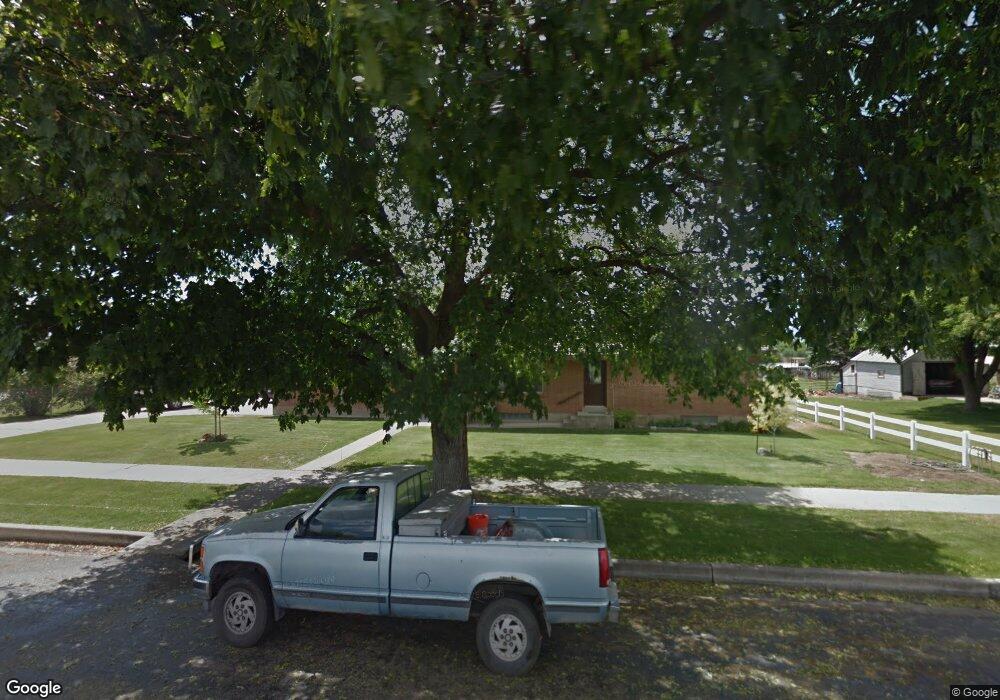
75 S 100 W Smithfield, UT 84335
Estimated Value: $452,000 - $524,000
5
Beds
2
Baths
2,928
Sq Ft
$170/Sq Ft
Est. Value
About This Home
This home is located at 75 S 100 W, Smithfield, UT 84335 and is currently estimated at $497,997, approximately $170 per square foot. 75 S 100 W is a home located in Cache County with nearby schools including Summit School, North Cache Middle School, and White Pine Middle School.
Ownership History
Date
Name
Owned For
Owner Type
Purchase Details
Closed on
Apr 10, 2024
Sold by
Sparks Bland K and Sparks Debbie
Bought by
Sparks Bland K and Sparks Deborah
Current Estimated Value
Home Financials for this Owner
Home Financials are based on the most recent Mortgage that was taken out on this home.
Original Mortgage
$249,999
Outstanding Balance
$240,856
Interest Rate
6.94%
Mortgage Type
Credit Line Revolving
Estimated Equity
$257,141
Purchase Details
Closed on
May 4, 2009
Sold by
Jorgensen Ray and Godfrey Ann J
Bought by
Sparks Bland K and Sparks Debbie
Home Financials for this Owner
Home Financials are based on the most recent Mortgage that was taken out on this home.
Original Mortgage
$100,000
Interest Rate
4.99%
Mortgage Type
New Conventional
Create a Home Valuation Report for This Property
The Home Valuation Report is an in-depth analysis detailing your home's value as well as a comparison with similar homes in the area
Home Values in the Area
Average Home Value in this Area
Purchase History
| Date | Buyer | Sale Price | Title Company |
|---|---|---|---|
| Sparks Bland K | -- | Prospect Title Insurance Agenc | |
| Sparks Bland K | -- | Hickman Land Title Company |
Source: Public Records
Mortgage History
| Date | Status | Borrower | Loan Amount |
|---|---|---|---|
| Open | Sparks Bland K | $249,999 | |
| Previous Owner | Sparks Bland K | $100,000 |
Source: Public Records
Tax History
| Year | Tax Paid | Tax Assessment Tax Assessment Total Assessment is a certain percentage of the fair market value that is determined by local assessors to be the total taxable value of land and additions on the property. | Land | Improvement |
|---|---|---|---|---|
| 2025 | $2,068 | $276,840 | $0 | $0 |
| 2024 | $1,983 | $249,085 | $0 | $0 |
| 2023 | $2,070 | $245,850 | $0 | $0 |
| 2022 | $2,104 | $245,845 | $0 | $0 |
| 2021 | $1,970 | $351,720 | $79,500 | $272,220 |
| 2020 | $1,735 | $288,900 | $79,500 | $209,400 |
| 2019 | $1,655 | $262,800 | $53,400 | $209,400 |
| 2018 | $1,337 | $203,180 | $53,400 | $149,780 |
| 2017 | $1,242 | $104,195 | $0 | $0 |
| 2016 | $1,264 | $104,195 | $0 | $0 |
| 2015 | $1,269 | $104,195 | $0 | $0 |
| 2014 | $1,245 | $104,210 | $0 | $0 |
| 2013 | -- | $99,315 | $0 | $0 |
Source: Public Records
Map
Nearby Homes
Your Personal Tour Guide
Ask me questions while you tour the home.