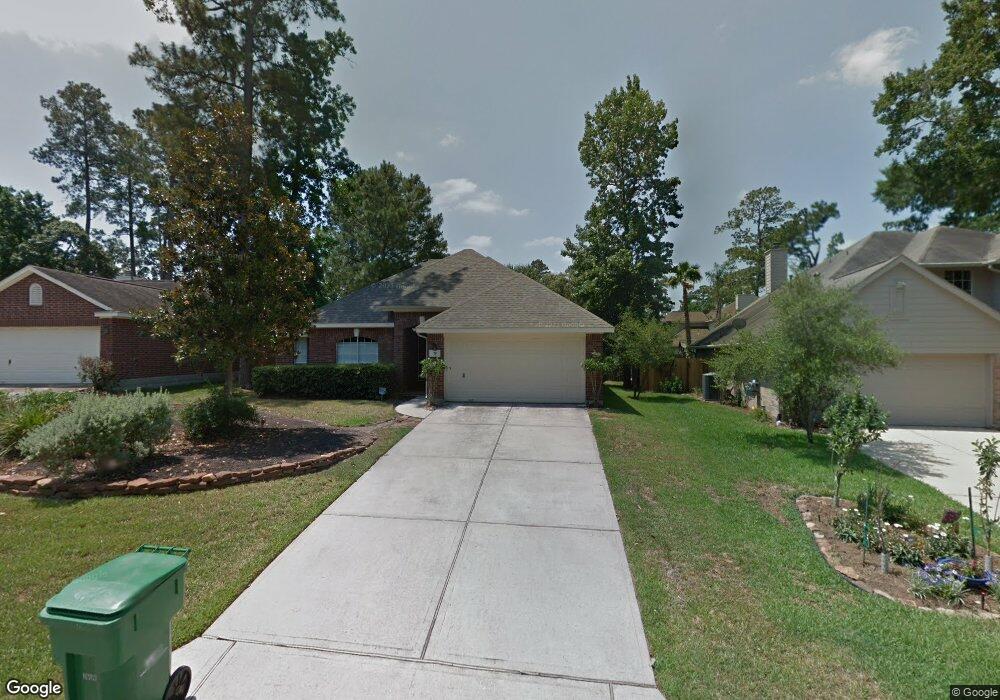
75 S Wynnoak Cir Spring, TX 77382
Alden Bridge NeighborhoodEstimated Value: $410,843 - $444,000
3
Beds
2
Baths
1,999
Sq Ft
$215/Sq Ft
Est. Value
About This Home
This home is located at 75 S Wynnoak Cir, Spring, TX 77382 and is currently estimated at $429,711, approximately $214 per square foot. 75 S Wynnoak Cir is a home located in Montgomery County with nearby schools including Buckalew Elementary School, Mitchell Intermediate School, and McCullough Junior High School.
Ownership History
Date
Name
Owned For
Owner Type
Purchase Details
Closed on
Nov 19, 2010
Sold by
Baugh David M and Baugh Brooke L
Bought by
Wix Joshua A and Wix Elaine K
Current Estimated Value
Home Financials for this Owner
Home Financials are based on the most recent Mortgage that was taken out on this home.
Original Mortgage
$187,376
Outstanding Balance
$123,502
Interest Rate
4.25%
Mortgage Type
FHA
Estimated Equity
$306,209
Purchase Details
Closed on
Oct 15, 2001
Sold by
Wall Jeremiah A and Wall Yewarner F
Bought by
Baugh David M and Baugh Brooke L
Home Financials for this Owner
Home Financials are based on the most recent Mortgage that was taken out on this home.
Original Mortgage
$140,000
Interest Rate
5.87%
Purchase Details
Closed on
Aug 30, 1999
Sold by
Lennar Homes Of Texas Inc
Bought by
Wall Jeremiah A and Wall Yewarner F
Home Financials for this Owner
Home Financials are based on the most recent Mortgage that was taken out on this home.
Original Mortgage
$120,000
Interest Rate
8.18%
Create a Home Valuation Report for This Property
The Home Valuation Report is an in-depth analysis detailing your home's value as well as a comparison with similar homes in the area
Home Values in the Area
Average Home Value in this Area
Purchase History
| Date | Buyer | Sale Price | Title Company |
|---|---|---|---|
| Wix Joshua A | -- | First American Title | |
| Baugh David M | -- | First American Title | |
| Wall Jeremiah A | -- | Regency Title Company |
Source: Public Records
Mortgage History
| Date | Status | Borrower | Loan Amount |
|---|---|---|---|
| Open | Wix Joshua A | $187,376 | |
| Previous Owner | Baugh David M | $140,000 | |
| Previous Owner | Wall Jeremiah A | $120,000 |
Source: Public Records
Tax History Compared to Growth
Tax History
| Year | Tax Paid | Tax Assessment Tax Assessment Total Assessment is a certain percentage of the fair market value that is determined by local assessors to be the total taxable value of land and additions on the property. | Land | Improvement |
|---|---|---|---|---|
| 2025 | $5,111 | $394,279 | -- | -- |
| 2024 | $4,589 | $358,435 | -- | -- |
| 2023 | $4,589 | $325,850 | $60,000 | $324,200 |
| 2022 | $6,004 | $296,230 | $60,000 | $275,670 |
| 2021 | $5,874 | $269,300 | $28,130 | $241,170 |
| 2020 | $6,051 | $261,580 | $28,130 | $233,450 |
| 2019 | $6,339 | $265,610 | $28,130 | $237,480 |
| 2018 | $5,476 | $259,860 | $28,130 | $237,480 |
| 2017 | $5,708 | $236,240 | $28,130 | $208,110 |
| 2016 | $5,708 | $236,240 | $28,130 | $208,110 |
| 2015 | $4,878 | $229,530 | $28,130 | $212,640 |
| 2014 | $4,878 | $208,660 | $28,130 | $193,070 |
Source: Public Records
Map
Nearby Homes
- 66 N Brooksedge Cir
- 22 Almond Branch Place
- 147 N Wynnoak Cir
- 23 Fortuneberry Place
- 14 Wintergrass Place
- 11 Lyreleaf Place
- 14 Broadweather Place
- 171 W Sundance Cir
- 30 Lyreleaf Place
- 3 Broadweather Place
- 35 Dewdrift Place
- 2 Sweet Birch Place
- 81 N Apple Springs Cir
- 15 Redland Place
- 14 Redland Place
- 413 New Forest Ln
- 70 Harvest Wind Place
- 33319 Lago Vista
- 143 S Goldenvine Cir
- 170 Linton Downs Place
- 71 S Wynnoak Cir
- 79 S Wynnoak Cir
- 67 S Wynnoak Cir
- 83 S Wynnoak Cir
- 62 N Brooksedge Cir
- 70 N Brooksedge Cir
- 58 N Brooksedge Cir
- 74 N Brooksedge Cir
- 70 S Wynnoak Cir
- 87 S Wynnoak Cir
- 74 S Wynnoak Cir
- 66 S Wynnoak Cir
- 54 N Brooksedge Cir
- 54 N Brooksedge CI
- 54 Brooksedge CI
- 78 S Wynnoak Cir
- 78 N Brooksedge Cir
- 62 S Wynnoak Cir
- 59 S Wynnoak Cir
- 91 S Wynnoak Cir