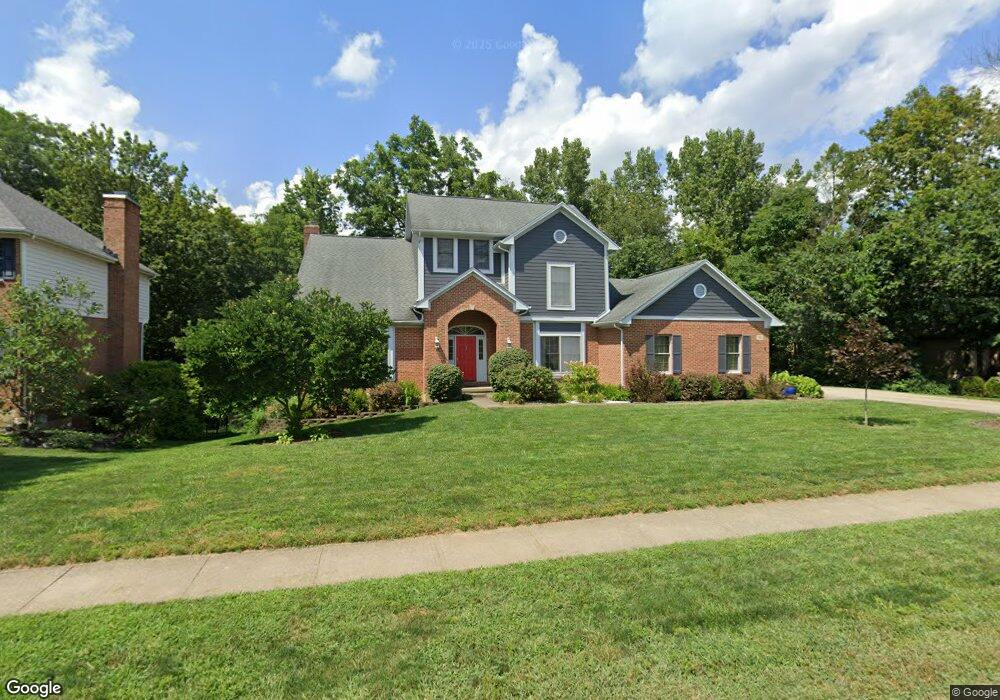
75 Shelford Way Beavercreek, OH 45440
Estimated Value: $571,000 - $612,000
5
Beds
4
Baths
3,525
Sq Ft
$167/Sq Ft
Est. Value
About This Home
This home is located at 75 Shelford Way, Beavercreek, OH 45440 and is currently estimated at $589,981, approximately $167 per square foot. 75 Shelford Way is a home located in Greene County with nearby schools including Fairbrook Elementary School, Herman K Ankeney Middle School, and Beavercreek High School.
Ownership History
Date
Name
Owned For
Owner Type
Purchase Details
Closed on
Jun 30, 2020
Sold by
Mcbride Tegg W and Mcbride Rebecca A
Bought by
Holsapple Mark A and Holsapple Megan M
Current Estimated Value
Home Financials for this Owner
Home Financials are based on the most recent Mortgage that was taken out on this home.
Original Mortgage
$349,740
Outstanding Balance
$310,126
Interest Rate
3.1%
Mortgage Type
Unknown
Estimated Equity
$279,855
Purchase Details
Closed on
Sep 15, 2015
Sold by
Lanier Raymond H and Lanier Karol H
Bought by
Mcbride Teg W and Mcbride Rebecca A
Home Financials for this Owner
Home Financials are based on the most recent Mortgage that was taken out on this home.
Original Mortgage
$219,500
Interest Rate
3.9%
Mortgage Type
Unknown
Purchase Details
Closed on
Nov 12, 1992
Bought by
Lanier Raymond H and Lanier Lanier
Create a Home Valuation Report for This Property
The Home Valuation Report is an in-depth analysis detailing your home's value as well as a comparison with similar homes in the area
Home Values in the Area
Average Home Value in this Area
Purchase History
| Date | Buyer | Sale Price | Title Company |
|---|---|---|---|
| Holsapple Mark A | $388,700 | None Available | |
| Mcbride Teg W | $319,500 | Attorney | |
| Lanier Raymond H | $253,700 | -- |
Source: Public Records
Mortgage History
| Date | Status | Borrower | Loan Amount |
|---|---|---|---|
| Open | Holsapple Mark A | $349,740 | |
| Previous Owner | Mcbride Teg W | $219,500 |
Source: Public Records
Tax History Compared to Growth
Tax History
| Year | Tax Paid | Tax Assessment Tax Assessment Total Assessment is a certain percentage of the fair market value that is determined by local assessors to be the total taxable value of land and additions on the property. | Land | Improvement |
|---|---|---|---|---|
| 2024 | $10,864 | $166,410 | $30,370 | $136,040 |
| 2023 | $10,864 | $166,410 | $30,370 | $136,040 |
| 2022 | $10,202 | $137,950 | $25,310 | $112,640 |
| 2021 | $9,995 | $136,760 | $25,310 | $111,450 |
| 2020 | $10,189 | $136,760 | $25,310 | $111,450 |
| 2019 | $10,605 | $129,950 | $20,490 | $109,460 |
| 2018 | $9,386 | $129,950 | $20,490 | $109,460 |
| 2017 | $8,460 | $129,950 | $20,490 | $109,460 |
| 2016 | $8,461 | $113,450 | $20,490 | $92,960 |
| 2015 | $8,217 | $113,450 | $20,490 | $92,960 |
| 2014 | $8,093 | $113,450 | $20,490 | $92,960 |
Source: Public Records
Map
Nearby Homes
- 149 Chartley Ct
- 70 Larchmere Dr
- 332 Skyland Dr
- 3211 Tarleton Dr
- 185 Bramblebush Trail
- 3080 Indian Ripple Rd
- 454 Skyland Dr
- 3597 Echo Hill Ln
- 3682 Echo Hill Ln
- 527 Viking Landing Ct
- 3534 Sunset Bluff Dr
- 356 Cork Elm Trail
- 337 Honey Jane Dr
- 3978 Indian Ripple Rd
- 24 Rosell Dr
- 679 S Alpha Bellbrook Rd
- 138 Ridgebrook Trail
- 131 Ridgebrook Trail
- 2804 Riverstone Dr
- 717 S Alpha Bellbrook Rd
- 81 Shelford Way
- 76 Earlsgate Rd
- 3397 Aldersgate Rd Unit 3397
- 3328 Darbyshire Dr
- 3330 Darbyshire Dr
- 3399 Aldersgate Rd Unit 3399
- 3401 Aldersgate Rd Unit 3401
- 3401 Aldersgate Rd
- 3403 Aldersgate Rd Unit 3403
- 3403 Aldersgate Rd
- 87 Shelford Way
- 94 Eastwick Ct
- 3336 Darbyshire Dr Unit 3336
- 81 Earlsgate Rd
- 3409 Aldersgate Rd
- 80 Earlsgate Rd
- 3398 Aldersgate Rd Unit 3398
- 99 Eastwick Ct
- 3340 Darbyshire Dr
- 3411 Aldersgate Rd Unit 3411