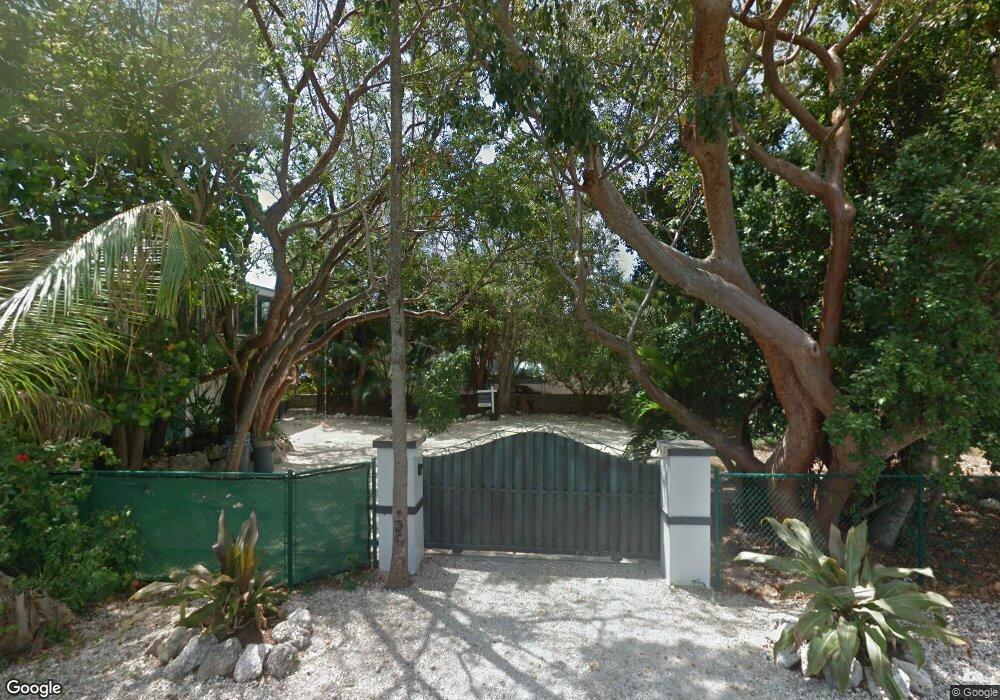
75 Shoreland Dr Key Largo, FL 33037
Estimated Value: $967,000 - $1,805,000
3
Beds
2
Baths
1,080
Sq Ft
$1,320/Sq Ft
Est. Value
About This Home
This home is located at 75 Shoreland Dr, Key Largo, FL 33037 and is currently estimated at $1,425,729, approximately $1,320 per square foot. 75 Shoreland Dr is a home located in Monroe County with nearby schools including Key Largo School, Coral Shores High School, and St. Justin Marine Academy.
Ownership History
Date
Name
Owned For
Owner Type
Purchase Details
Closed on
May 19, 2004
Sold by
Delk Anne L
Bought by
Martinez Juan C
Current Estimated Value
Home Financials for this Owner
Home Financials are based on the most recent Mortgage that was taken out on this home.
Original Mortgage
$100,000
Outstanding Balance
$47,422
Interest Rate
5.88%
Mortgage Type
Unknown
Estimated Equity
$1,378,307
Purchase Details
Closed on
Mar 30, 2004
Sold by
Martinez Juan C
Bought by
Underwood Paul A and Underwood Marie C
Home Financials for this Owner
Home Financials are based on the most recent Mortgage that was taken out on this home.
Original Mortgage
$100,000
Outstanding Balance
$47,422
Interest Rate
5.88%
Mortgage Type
Unknown
Estimated Equity
$1,378,307
Purchase Details
Closed on
Feb 1, 1976
Bought by
Martinez Juan C
Create a Home Valuation Report for This Property
The Home Valuation Report is an in-depth analysis detailing your home's value as well as a comparison with similar homes in the area
Home Values in the Area
Average Home Value in this Area
Purchase History
| Date | Buyer | Sale Price | Title Company |
|---|---|---|---|
| Martinez Juan C | $550,000 | -- | |
| Underwood Paul A | $250,000 | -- | |
| Martinez Juan C | $65,000 | -- |
Source: Public Records
Mortgage History
| Date | Status | Borrower | Loan Amount |
|---|---|---|---|
| Open | Martinez Juan C | $100,000 | |
| Previous Owner | Underwood Paul A | $225,000 |
Source: Public Records
Tax History
| Year | Tax Paid | Tax Assessment Tax Assessment Total Assessment is a certain percentage of the fair market value that is determined by local assessors to be the total taxable value of land and additions on the property. | Land | Improvement |
|---|---|---|---|---|
| 2025 | $6,356 | $763,003 | -- | -- |
| 2024 | $6,138 | $741,500 | -- | -- |
| 2023 | $6,138 | $719,903 | $0 | $0 |
| 2022 | $5,784 | $698,935 | $0 | $0 |
| 2021 | $5,902 | $678,578 | $0 | $0 |
| 2020 | $5,864 | $669,210 | $0 | $0 |
| 2019 | $5,752 | $654,165 | $0 | $0 |
| 2018 | $5,752 | $641,968 | $0 | $0 |
| 2017 | $5,631 | $628,764 | $0 | $0 |
| 2016 | $5,710 | $615,832 | $0 | $0 |
| 2015 | $5,775 | $611,551 | $0 | $0 |
| 2014 | $5,890 | $606,697 | $0 | $0 |
Source: Public Records
Map
Nearby Homes
- 77 Shoreland Dr
- 73 Shoreland Dr
- 79 Shoreland Dr
- 71 Shoreland Dr
- 69 Shoreland Dr
- 76 Shoreland Dr
- 70 Bonefish Ave
- 68 Bonefish Ave
- 74 Shoreland Dr
- 66 Bonefish Ave
- 72 Shoreland Dr
- 72 Bonefish Ave
- 67 Shoreland Dr
- 64 Bonefish Ave
- 70 Shoreland Dr
- 65 Shoreland Dr
- 65 Bonefish Ave
- 63 Bass Ave Unit 1
- 63 Bass Ave Unit 2
- 63 Bass Ave
Your Personal Tour Guide
Ask me questions while you tour the home.