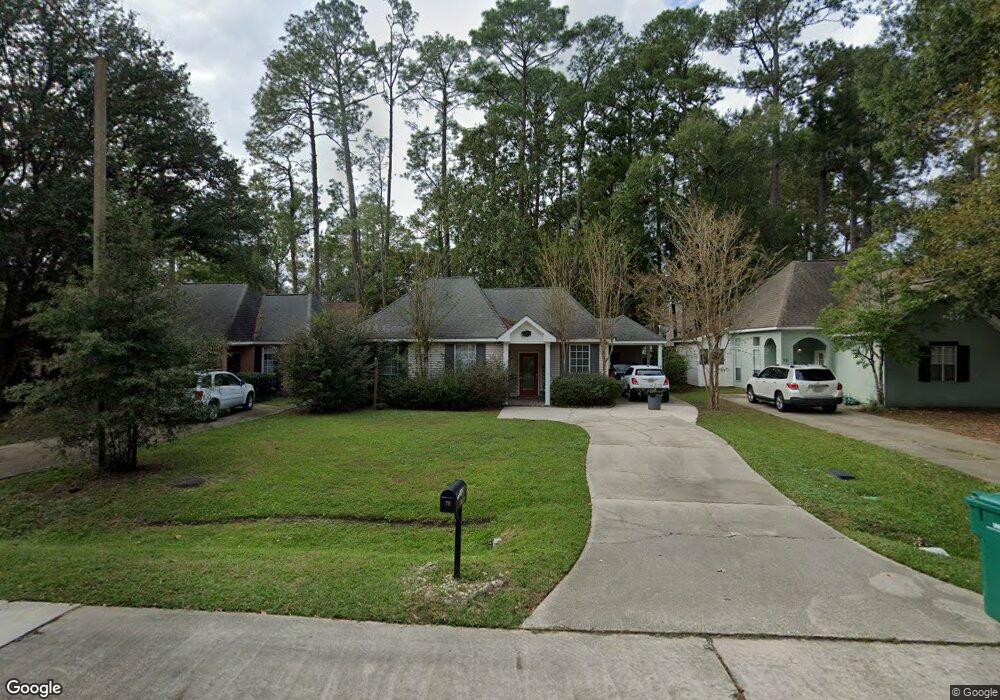
75 Trace Loop None Mandeville, LA 70448
Estimated Value: $236,000 - $268,000
3
Beds
2
Baths
1,433
Sq Ft
$176/Sq Ft
Est. Value
About This Home
This home is located at 75 Trace Loop None, Mandeville, LA 70448 and is currently estimated at $252,577, approximately $176 per square foot. 75 Trace Loop None is a home located in St. Tammany Parish with nearby schools including Woodlake Elementary School, Mandeville Middle School, and Fontainebleau Junior High School.
Ownership History
Date
Name
Owned For
Owner Type
Purchase Details
Closed on
Feb 16, 2024
Sold by
Laughlin Harold
Bought by
Laughlin Pamela
Current Estimated Value
Purchase Details
Closed on
Oct 14, 2022
Sold by
Muth Susan G
Bought by
Laughlin Pamela Holly and Laughlin Samuel
Home Financials for this Owner
Home Financials are based on the most recent Mortgage that was taken out on this home.
Original Mortgage
$201,600
Interest Rate
6.7%
Mortgage Type
New Conventional
Purchase Details
Closed on
Oct 7, 2010
Sold by
Williams Janice Celine
Bought by
Muth Susan G
Home Financials for this Owner
Home Financials are based on the most recent Mortgage that was taken out on this home.
Original Mortgage
$160,340
Interest Rate
4.38%
Mortgage Type
FHA
Purchase Details
Closed on
Aug 10, 2009
Sold by
Caston Alma Jones and Caston Dale C
Bought by
Williams Janice Celine
Create a Home Valuation Report for This Property
The Home Valuation Report is an in-depth analysis detailing your home's value as well as a comparison with similar homes in the area
Home Values in the Area
Average Home Value in this Area
Purchase History
| Date | Buyer | Sale Price | Title Company |
|---|---|---|---|
| Laughlin Pamela | -- | None Listed On Document | |
| Laughlin Pamela | -- | None Listed On Document | |
| Laughlin Pamela Holly | $252,000 | Title Solution Services | |
| Muth Susan G | $162,500 | Mahony Title & Land Services | |
| Williams Janice Celine | $164,500 | None Available |
Source: Public Records
Mortgage History
| Date | Status | Borrower | Loan Amount |
|---|---|---|---|
| Previous Owner | Laughlin Pamela Holly | $201,600 | |
| Previous Owner | Muth Susan G | $160,340 |
Source: Public Records
Tax History
| Year | Tax Paid | Tax Assessment Tax Assessment Total Assessment is a certain percentage of the fair market value that is determined by local assessors to be the total taxable value of land and additions on the property. | Land | Improvement |
|---|---|---|---|---|
| 2025 | $1,325 | $18,545 | $2,958 | $15,587 |
| 2024 | $1,325 | $18,545 | $2,958 | $15,587 |
| 2023 | $1,374 | $18,545 | $2,958 | $15,587 |
| 2022 | $79,925 | $13,530 | $2,958 | $10,572 |
| 2021 | $798 | $13,530 | $2,958 | $10,572 |
| 2020 | $797 | $13,530 | $2,958 | $10,572 |
| 2019 | $1,855 | $13,530 | $2,958 | $10,572 |
| 2018 | $1,858 | $13,530 | $2,958 | $10,572 |
| 2017 | $1,875 | $13,530 | $2,958 | $10,572 |
| 2016 | $1,890 | $13,530 | $2,958 | $10,572 |
| 2015 | $865 | $13,530 | $2,958 | $10,572 |
| 2014 | $856 | $13,530 | $2,958 | $10,572 |
| 2013 | -- | $13,530 | $2,958 | $10,572 |
Source: Public Records
Map
Nearby Homes
- 75 Trace Loop
- 79 Trace Loop
- 79 Trace Loop Other
- 69 Trace Loop
- 102 Trace Loop Unit 104
- 188 Trace Loop Unit 188
- 180 Trace Loop
- 104 Trace Loop Unit 100
- 182 Trace Loop
- 172 Trace Loop
- 176 Trace Loop
- 176 Trace Loop
- 176 Trace Loop
- 182 Trace Loop
- 184 Trace Loop
- 172 Trace Loop
- 102 Trace Loop
- 104 Trace Loop
- 180 Trace Loop
- 65 Trace Loop
Your Personal Tour Guide
Ask me questions while you tour the home.