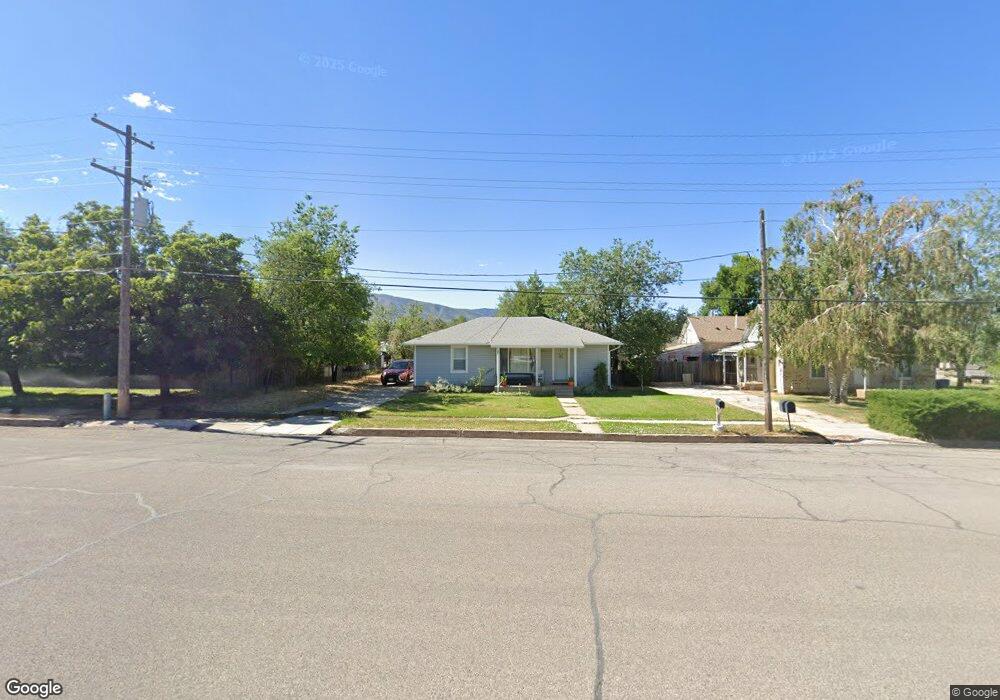
75 W 100 N Fillmore, UT 84631
Estimated Value: $204,000 - $251,000
3
Beds
1
Bath
1,032
Sq Ft
$218/Sq Ft
Est. Value
About This Home
This home is located at 75 W 100 N, Fillmore, UT 84631 and is currently estimated at $224,802, approximately $217 per square foot. 75 W 100 N is a home located in Millard County.
Ownership History
Date
Name
Owned For
Owner Type
Purchase Details
Closed on
Nov 29, 2018
Sold by
Hiatt Michael E
Bought by
Monroy Apolonio
Current Estimated Value
Purchase Details
Closed on
Jun 6, 2018
Sold by
Hiatt Ryan
Bought by
Hiatt Michael E
Purchase Details
Closed on
Oct 2, 2017
Sold by
Adams Adams L and Adams Lornajayne B
Bought by
Hiatt Michael E and Hiatt Ryan W
Purchase Details
Closed on
Jun 7, 2006
Sold by
Fisher Margaret
Bought by
Adams Adams L and Adams Lornajayne B
Home Financials for this Owner
Home Financials are based on the most recent Mortgage that was taken out on this home.
Original Mortgage
$62,985
Interest Rate
6.57%
Mortgage Type
New Conventional
Create a Home Valuation Report for This Property
The Home Valuation Report is an in-depth analysis detailing your home's value as well as a comparison with similar homes in the area
Home Values in the Area
Average Home Value in this Area
Purchase History
| Date | Buyer | Sale Price | Title Company |
|---|---|---|---|
| Monroy Apolonio | -- | First American Title | |
| Hiatt Michael E | -- | First American Title | |
| Hiatt Michael E | -- | First American Title | |
| Adams Adams L | -- | -- |
Source: Public Records
Mortgage History
| Date | Status | Borrower | Loan Amount |
|---|---|---|---|
| Previous Owner | Adams Adams L | $62,985 |
Source: Public Records
Tax History Compared to Growth
Tax History
| Year | Tax Paid | Tax Assessment Tax Assessment Total Assessment is a certain percentage of the fair market value that is determined by local assessors to be the total taxable value of land and additions on the property. | Land | Improvement |
|---|---|---|---|---|
| 2025 | $650 | $81,632 | $14,197 | $67,435 |
| 2024 | $650 | $81,920 | $20,292 | $61,628 |
| 2023 | $933 | $81,920 | $20,292 | $61,628 |
| 2022 | $743 | $66,751 | $18,448 | $48,303 |
| 2021 | $633 | $54,531 | $11,979 | $42,552 |
| 2020 | $584 | $50,683 | $10,890 | $39,793 |
| 2019 | $506 | $44,026 | $10,890 | $33,136 |
| 2018 | $484 | $43,092 | $10,890 | $32,202 |
| 2017 | $413 | $34,970 | $10,890 | $24,080 |
| 2016 | $395 | $34,970 | $10,890 | $24,080 |
| 2015 | $395 | $34,970 | $10,890 | $24,080 |
| 2014 | -- | $34,970 | $10,890 | $24,080 |
| 2013 | -- | $34,970 | $10,890 | $24,080 |
Source: Public Records
Map
Nearby Homes
- 75 N 100 West St
- 165 N 100 W
- 295 N 100 West St
- 225 W 200 St N
- 40 S 100 Rd E
- 390 N 100 W
- 380 N 200 St W
- 335 W 400 North St
- 220 S 200 E
- 190 W 400 St S
- 310 S 500 West Rd
- 430 E Canyon Rd
- 155 E 500 St S
- 157 E 500 South St
- 410 W 400 N
- 310 S 600 E
- 405 E 500 St S
- 690 E 500 S
- 760 E 700 St S
- 750 800 South Fillmore