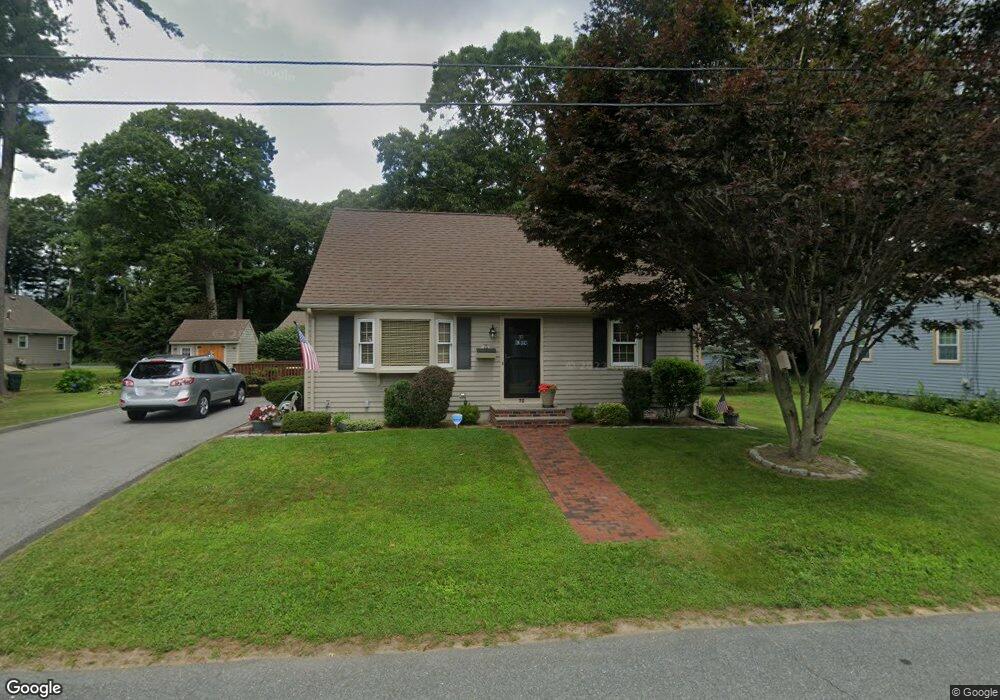
75 Wamsutta Ave Acushnet, MA 02743
Upper Acushnet NeighborhoodEstimated Value: $437,000 - $547,000
3
Beds
1
Bath
1,265
Sq Ft
$383/Sq Ft
Est. Value
About This Home
This home is located at 75 Wamsutta Ave, Acushnet, MA 02743 and is currently estimated at $484,401, approximately $382 per square foot. 75 Wamsutta Ave is a home located in Bristol County with nearby schools including Acushnet Elementary School, Albert F Ford Middle School, and Alma Del Mar Charter School.
Ownership History
Date
Name
Owned For
Owner Type
Purchase Details
Closed on
May 11, 2015
Sold by
Metro Alan J and Metro Carol A
Bought by
Metro Ft and Metro
Current Estimated Value
Purchase Details
Closed on
Jun 18, 1991
Sold by
Fitzpatrick Brian A and Fitzpatric Patricia
Bought by
Metro Alan J and Metro Carol A
Purchase Details
Closed on
Aug 14, 1987
Sold by
Mccombs Charles
Bought by
Fitzpatrick Brian A
Create a Home Valuation Report for This Property
The Home Valuation Report is an in-depth analysis detailing your home's value as well as a comparison with similar homes in the area
Home Values in the Area
Average Home Value in this Area
Purchase History
| Date | Buyer | Sale Price | Title Company |
|---|---|---|---|
| Metro Ft | -- | -- | |
| Metro Alan J | $135,000 | -- | |
| Metro Alan J | $135,000 | -- | |
| Fitzpatrick Brian A | $124,000 | -- |
Source: Public Records
Mortgage History
| Date | Status | Borrower | Loan Amount |
|---|---|---|---|
| Previous Owner | Fitzpatrick Brian A | $81,809 | |
| Previous Owner | Fitzpatrick Brian A | $22,800 | |
| Previous Owner | Fitzpatrick Brian A | $74,500 |
Source: Public Records
Tax History
| Year | Tax Paid | Tax Assessment Tax Assessment Total Assessment is a certain percentage of the fair market value that is determined by local assessors to be the total taxable value of land and additions on the property. | Land | Improvement |
|---|---|---|---|---|
| 2025 | $43 | $398,800 | $119,100 | $279,700 |
| 2024 | $3,980 | $348,800 | $112,900 | $235,900 |
| 2023 | $4,008 | $334,000 | $102,400 | $231,600 |
| 2022 | $3,950 | $297,700 | $96,100 | $201,600 |
| 2021 | $3,659 | $264,600 | $96,100 | $168,500 |
| 2020 | $3,602 | $258,400 | $89,900 | $168,500 |
| 2019 | $3,399 | $239,700 | $85,700 | $154,000 |
| 2018 | $3,282 | $227,600 | $85,700 | $141,900 |
| 2017 | $3,162 | $219,000 | $85,700 | $133,300 |
| 2016 | $3,207 | $220,700 | $85,700 | $135,000 |
| 2015 | -- | $205,400 | $85,700 | $119,700 |
Source: Public Records
Map
Nearby Homes
Your Personal Tour Guide
Ask me questions while you tour the home.