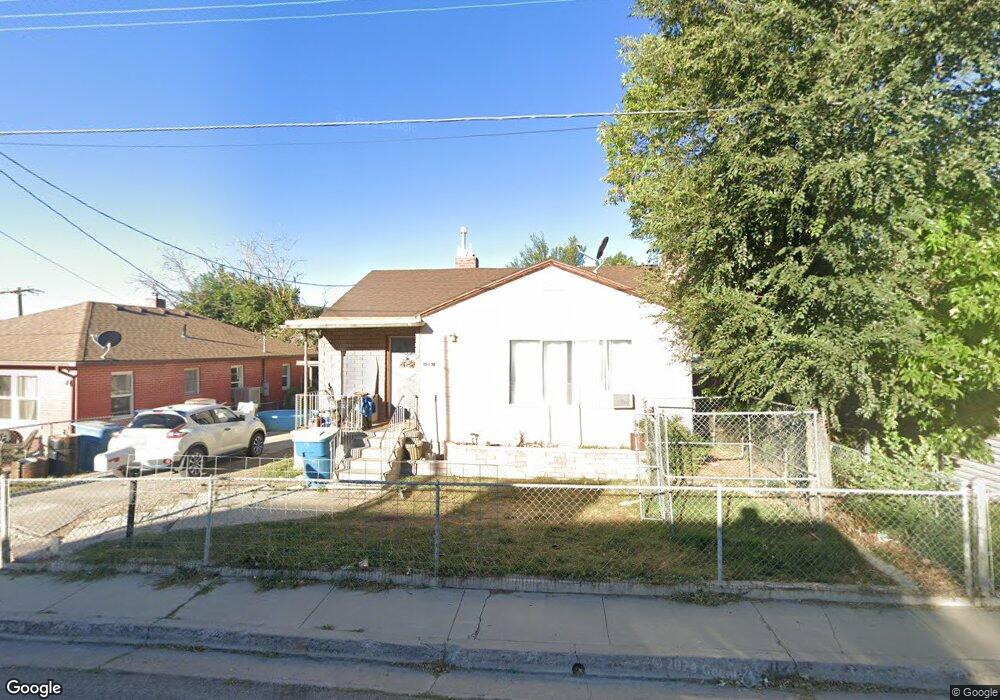
75 Welby St Helper, UT 84526
Estimated Value: $201,000 - $305,160
4
Beds
2
Baths
1,119
Sq Ft
$231/Sq Ft
Est. Value
About This Home
This home is located at 75 Welby St, Helper, UT 84526 and is currently estimated at $258,040, approximately $230 per square foot. 75 Welby St is a home located in Carbon County with nearby schools including Sally Mauro School, Helper Middle School, and Carbon High School.
Ownership History
Date
Name
Owned For
Owner Type
Purchase Details
Closed on
Dec 12, 2019
Sold by
Child Lisa D and Child Daniel T
Bought by
Haycock Tyson G
Current Estimated Value
Home Financials for this Owner
Home Financials are based on the most recent Mortgage that was taken out on this home.
Original Mortgage
$84,147
Outstanding Balance
$74,722
Interest Rate
4.4%
Mortgage Type
FHA
Estimated Equity
$183,318
Purchase Details
Closed on
Jul 21, 2011
Sold by
Davis Thomas William
Bought by
Child Lisa D and Child Daniel T
Create a Home Valuation Report for This Property
The Home Valuation Report is an in-depth analysis detailing your home's value as well as a comparison with similar homes in the area
Home Values in the Area
Average Home Value in this Area
Purchase History
| Date | Buyer | Sale Price | Title Company |
|---|---|---|---|
| Haycock Tyson G | -- | South Eastern Utah Title Co | |
| Child Lisa D | -- | -- |
Source: Public Records
Mortgage History
| Date | Status | Borrower | Loan Amount |
|---|---|---|---|
| Open | Haycock Tyson G | $84,147 |
Source: Public Records
Tax History
| Year | Tax Paid | Tax Assessment Tax Assessment Total Assessment is a certain percentage of the fair market value that is determined by local assessors to be the total taxable value of land and additions on the property. | Land | Improvement |
|---|---|---|---|---|
| 2025 | $1,248 | $97,644 | $14,157 | $83,487 |
| 2024 | $1,638 | $132,592 | $14,972 | $117,620 |
| 2023 | $1,528 | $129,585 | $17,185 | $112,400 |
| 2022 | $1,351 | $100,770 | $11,916 | $88,854 |
| 2021 | $1,192 | $139,380 | $15,300 | $124,080 |
| 2020 | $1,131 | $66,429 | $0 | $0 |
| 2019 | $964 | $58,421 | $0 | $0 |
| 2018 | $937 | $58,421 | $0 | $0 |
| 2017 | $926 | $58,421 | $0 | $0 |
| 2016 | $849 | $58,421 | $0 | $0 |
| 2015 | $849 | $58,421 | $0 | $0 |
| 2014 | $823 | $56,876 | $0 | $0 |
| 2013 | $826 | $56,876 | $0 | $0 |
Source: Public Records
Map
Nearby Homes
- 47 B St
- 57 C St
- 2350 N 1075 W
- 79 Garden St
- 73 Garden St
- 46 E St
- 10 S 100 W
- 347 Hill St
- 1377 Frontage Rd
- 819 Castle Gate Cir
- 1630 W 4200 N Unit 5
- 5441 N Eagle Dr
- 451 E 6000 N
- 5931 N 550 E
- 49 Aspen Cove Dr Unit 49
- 135 Aspen Dr Unit 135
- 109 Aspen Cove Dr Unit 109
- 5350 Dry Valley Rd Unit 61
- 24 N Dry Valley Rd Unit 24
- 6 Aspen Cove Dr Unit 6
Your Personal Tour Guide
Ask me questions while you tour the home.