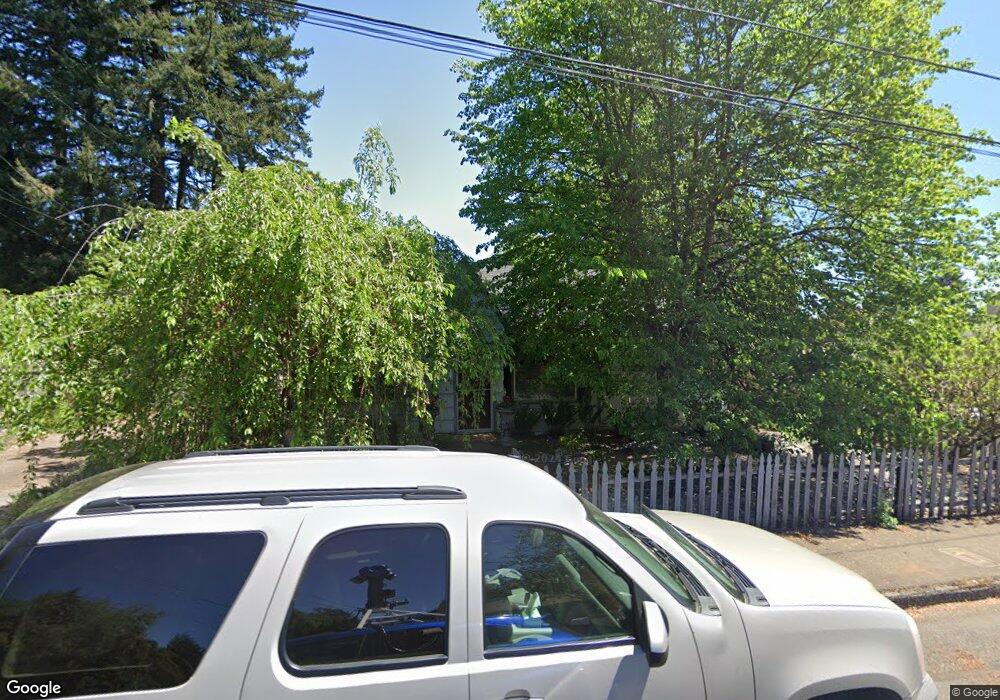
750 20th St Washougal, WA 98671
Estimated Value: $312,000 - $388,000
2
Beds
1
Bath
1,002
Sq Ft
$355/Sq Ft
Est. Value
About This Home
This home is located at 750 20th St, Washougal, WA 98671 and is currently estimated at $355,927, approximately $355 per square foot. 750 20th St is a home located in Clark County with nearby schools including Hathaway Elementary School, Jemtegaard Middle School, and Washougal High School.
Ownership History
Date
Name
Owned For
Owner Type
Purchase Details
Closed on
Nov 2, 2021
Sold by
Deflbaugh Christina
Bought by
Deflbaugh Cristina and Abc Family Revocable Trust
Current Estimated Value
Purchase Details
Closed on
Sep 29, 2020
Sold by
Templin Fair Llc
Bought by
Defibaugh Christina
Purchase Details
Closed on
Feb 22, 2005
Sold by
Stoddard Janet I
Bought by
Templin Fair Llc
Home Financials for this Owner
Home Financials are based on the most recent Mortgage that was taken out on this home.
Original Mortgage
$35,000
Interest Rate
5.73%
Mortgage Type
Seller Take Back
Purchase Details
Closed on
Sep 13, 2000
Sold by
Stoddard Michael A
Bought by
Stoddard Janet I
Home Financials for this Owner
Home Financials are based on the most recent Mortgage that was taken out on this home.
Original Mortgage
$25,000
Interest Rate
8.11%
Mortgage Type
Stand Alone Second
Create a Home Valuation Report for This Property
The Home Valuation Report is an in-depth analysis detailing your home's value as well as a comparison with similar homes in the area
Home Values in the Area
Average Home Value in this Area
Purchase History
| Date | Buyer | Sale Price | Title Company |
|---|---|---|---|
| Deflbaugh Cristina | -- | None Available | |
| Defibaugh Christina | $220,000 | Fidelity Natl Ttl Vancouver | |
| Templin Fair Llc | $125,000 | Clark County Title | |
| Stoddard Janet I | -- | Clark County Title Company |
Source: Public Records
Mortgage History
| Date | Status | Borrower | Loan Amount |
|---|---|---|---|
| Previous Owner | Templin Fair Llc | $35,000 | |
| Previous Owner | Stoddard Janet I | $25,000 |
Source: Public Records
Tax History Compared to Growth
Tax History
| Year | Tax Paid | Tax Assessment Tax Assessment Total Assessment is a certain percentage of the fair market value that is determined by local assessors to be the total taxable value of land and additions on the property. | Land | Improvement |
|---|---|---|---|---|
| 2025 | $3,155 | $285,633 | $118,148 | $167,485 |
| 2024 | $3,046 | $332,278 | $163,044 | $169,234 |
| 2023 | $2,916 | $335,579 | $163,044 | $172,535 |
| 2022 | $2,938 | $314,668 | $155,955 | $158,713 |
| 2021 | $2,794 | $275,196 | $137,052 | $138,144 |
| 2020 | $2,545 | $245,610 | $124,055 | $121,555 |
| 2019 | $1,946 | $227,262 | $118,148 | $109,114 |
| 2018 | $2,121 | $183,627 | $0 | $0 |
| 2017 | $1,776 | $165,241 | $0 | $0 |
| 2016 | $1,677 | $151,935 | $0 | $0 |
| 2015 | $1,534 | $131,212 | $0 | $0 |
| 2014 | -- | $119,413 | $0 | $0 |
| 2013 | -- | $106,554 | $0 | $0 |
Source: Public Records
Map
Nearby Homes