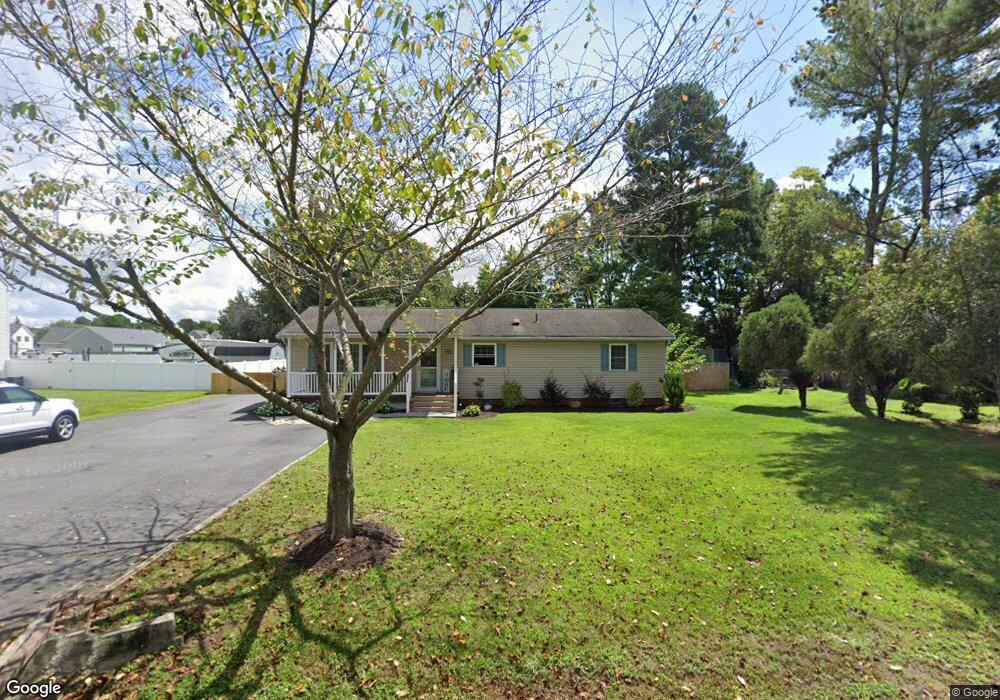
750 Bagby St West Point, VA 23181
Estimated Value: $282,534 - $328,000
3
Beds
2
Baths
1,540
Sq Ft
$200/Sq Ft
Est. Value
About This Home
This home is located at 750 Bagby St, West Point, VA 23181 and is currently estimated at $308,384, approximately $200 per square foot. 750 Bagby St is a home located in King William County with nearby schools including West Point Elementary School, West Point Middle School, and West Point High School.
Ownership History
Date
Name
Owned For
Owner Type
Purchase Details
Closed on
May 30, 2023
Sold by
Trombley Timothy J
Bought by
Fitchett Timothy Gaige and Fitchett Amanda Ann
Current Estimated Value
Home Financials for this Owner
Home Financials are based on the most recent Mortgage that was taken out on this home.
Original Mortgage
$13,500
Outstanding Balance
$1,449
Interest Rate
6.39%
Mortgage Type
New Conventional
Estimated Equity
$306,935
Purchase Details
Closed on
Mar 23, 2023
Sold by
Trombley Patricia A and Trombley Alton B
Bought by
Trombley Timothy J
Purchase Details
Closed on
Nov 27, 2009
Sold by
Us Bank National Association
Bought by
Trombley Alton B
Purchase Details
Closed on
Jul 27, 2006
Sold by
Buckley Robert C
Bought by
Ceja Mike E
Home Financials for this Owner
Home Financials are based on the most recent Mortgage that was taken out on this home.
Original Mortgage
$164,050
Interest Rate
6.67%
Mortgage Type
New Conventional
Create a Home Valuation Report for This Property
The Home Valuation Report is an in-depth analysis detailing your home's value as well as a comparison with similar homes in the area
Home Values in the Area
Average Home Value in this Area
Purchase History
| Date | Buyer | Sale Price | Title Company |
|---|---|---|---|
| Fitchett Timothy Gaige | $270,000 | Fidelity National Title | |
| Trombley Timothy J | -- | -- | |
| Trombley Alton B | $114,000 | -- | |
| Ceja Mike E | $193,000 | -- |
Source: Public Records
Mortgage History
| Date | Status | Borrower | Loan Amount |
|---|---|---|---|
| Open | Fitchett Timothy Gaige | $13,500 | |
| Open | Fitchett Timothy Gaige | $265,109 | |
| Previous Owner | Ceja Mike E | $164,050 |
Source: Public Records
Tax History Compared to Growth
Tax History
| Year | Tax Paid | Tax Assessment Tax Assessment Total Assessment is a certain percentage of the fair market value that is determined by local assessors to be the total taxable value of land and additions on the property. | Land | Improvement |
|---|---|---|---|---|
| 2025 | $637 | $209,000 | $28,000 | $181,000 |
| 2024 | $564 | $209,000 | $28,000 | $181,000 |
| 2023 | $564 | $209,000 | $28,000 | $181,000 |
| 2022 | $605 | $161,300 | $28,000 | $133,300 |
| 2021 | $613 | $161,300 | $28,000 | $133,300 |
| 2020 | $613 | $192,600 | $27,000 | $165,600 |
| 2019 | $613 | $148,900 | $28,000 | $120,900 |
| 2018 | $629 | $161,300 | $28,000 | $133,300 |
| 2017 | $653 | $161,300 | $28,000 | $133,300 |
| 2016 | $661 | $161,300 | $28,000 | $133,300 |
| 2015 | $694 | $161,300 | $28,000 | $133,300 |
| 2014 | $655 | $0 | $0 | $0 |
Source: Public Records
Map
Nearby Homes
- 330 Pointers Dr
- 311 Pointers Dr
- 321 Pointers Dr
- 2660 N Oak Ln
- 4204 Mattaponi Ave
- 3557 Odi St
- 3559 Odi St
- 342 Ogden St
- 332 Ogden St
- 322 Ogden St
- 314 Ogden St
- 605 Rivergate Terrace
- .21ac King William Ave
- Lot 24 King William Ave
- Lot 25 King William Ave
- 3050 King William Ave
- Lot 23 Glen St
- 000 Glen St
- .21ac Glen St
- 00 Glen St