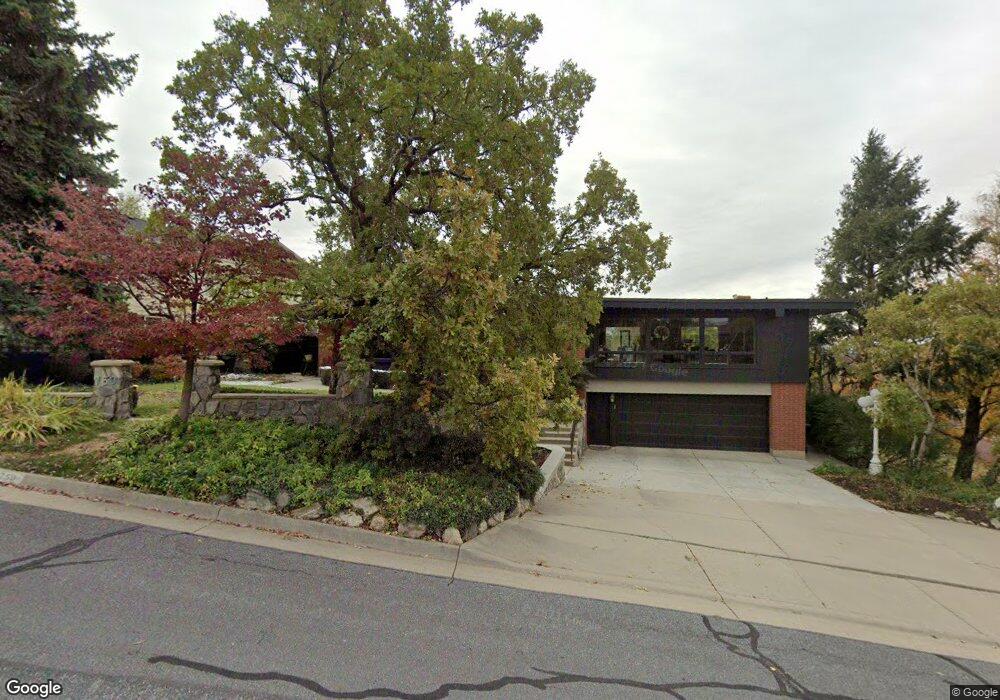
750 E Center St Centerville, UT 84014
Estimated Value: $595,000 - $761,000
5
Beds
3
Baths
2,203
Sq Ft
$318/Sq Ft
Est. Value
About This Home
This home is located at 750 E Center St, Centerville, UT 84014 and is currently estimated at $700,895, approximately $318 per square foot. 750 E Center St is a home located in Davis County with nearby schools including Centerville Elementary, Centerville Jr High, and Viewmont High School.
Ownership History
Date
Name
Owned For
Owner Type
Purchase Details
Closed on
Jul 17, 2009
Sold by
Craven Dorothy L and Craven Brent H
Bought by
Craven Dorothy L
Current Estimated Value
Home Financials for this Owner
Home Financials are based on the most recent Mortgage that was taken out on this home.
Original Mortgage
$280,000
Interest Rate
5.59%
Mortgage Type
New Conventional
Purchase Details
Closed on
May 21, 2004
Sold by
Craven Brent H and Craven Dorothy L
Bought by
Craven Dorothy L
Purchase Details
Closed on
May 12, 1999
Sold by
Craven Brent H
Bought by
Craven Brent H and Craven Dorothy L
Home Financials for this Owner
Home Financials are based on the most recent Mortgage that was taken out on this home.
Original Mortgage
$152,500
Interest Rate
6.53%
Create a Home Valuation Report for This Property
The Home Valuation Report is an in-depth analysis detailing your home's value as well as a comparison with similar homes in the area
Purchase History
| Date | Buyer | Sale Price | Title Company |
|---|---|---|---|
| Craven Dorothy L | -- | Executive Title Ins Agency | |
| Craven Dorothy L | -- | Executive Title Ins Agency | |
| Craven Dorothy L | -- | -- | |
| Craven Brent H | -- | Preferred Title & Escrow |
Source: Public Records
Mortgage History
| Date | Status | Borrower | Loan Amount |
|---|---|---|---|
| Closed | Craven Dorothy L | $280,000 | |
| Closed | Craven Brent H | $152,500 |
Source: Public Records
Tax History
| Year | Tax Paid | Tax Assessment Tax Assessment Total Assessment is a certain percentage of the fair market value that is determined by local assessors to be the total taxable value of land and additions on the property. | Land | Improvement |
|---|---|---|---|---|
| 2025 | $4,013 | $383,900 | $190,105 | $193,795 |
| 2024 | $3,827 | $372,350 | $175,599 | $196,751 |
| 2023 | $3,692 | $649,000 | $295,238 | $353,762 |
| 2022 | $3,858 | $373,450 | $150,399 | $223,051 |
| 2021 | $3,316 | $500,000 | $237,021 | $262,979 |
| 2020 | $2,832 | $427,000 | $227,716 | $199,284 |
| 2019 | $2,873 | $423,000 | $215,940 | $207,060 |
| 2018 | $2,681 | $390,000 | $199,713 | $190,287 |
| 2016 | $2,373 | $191,840 | $74,125 | $117,715 |
| 2015 | $2,344 | $178,805 | $74,125 | $104,680 |
| 2014 | $2,247 | $175,353 | $74,125 | $101,228 |
| 2013 | -- | $165,027 | $61,497 | $103,530 |
Source: Public Records
Map
Nearby Homes
Your Personal Tour Guide
Ask me questions while you tour the home.