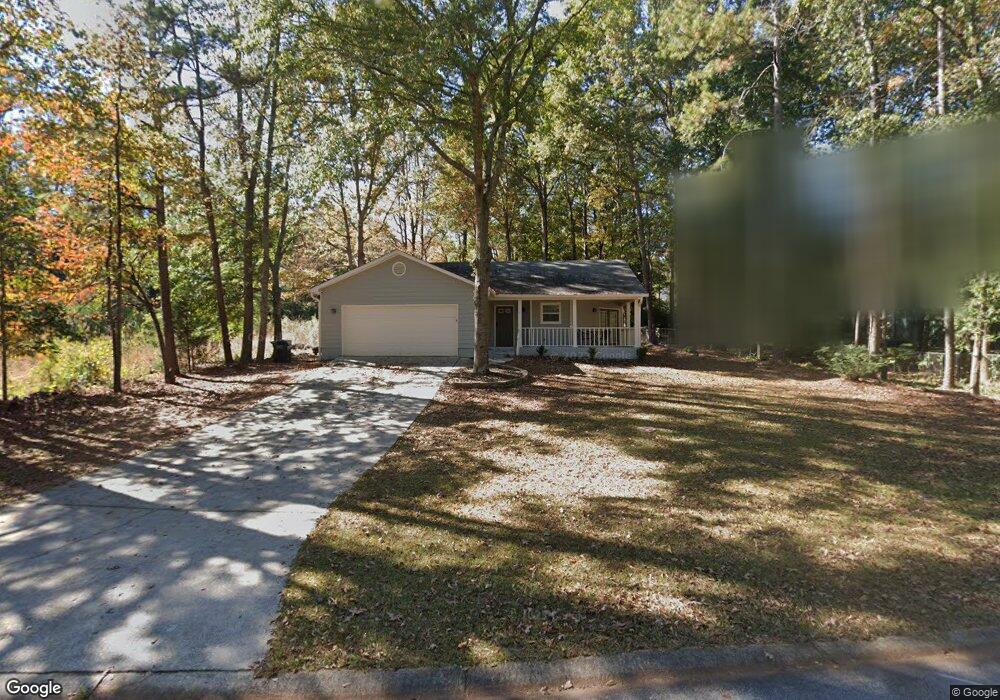
750 Greenview Ave SE Unit 14 Conyers, GA 30094
Estimated Value: $223,465 - $259,000
3
Beds
2
Baths
1,464
Sq Ft
$164/Sq Ft
Est. Value
About This Home
This home is located at 750 Greenview Ave SE Unit 14, Conyers, GA 30094 and is currently estimated at $239,616, approximately $163 per square foot. 750 Greenview Ave SE Unit 14 is a home located in Rockdale County with nearby schools including Sims Elementary School, Edwards Middle School, and Heritage High School.
Ownership History
Date
Name
Owned For
Owner Type
Purchase Details
Closed on
Nov 25, 2019
Sold by
Eph 2 Assets Llc
Bought by
Alto Asset Company 1 Llc
Current Estimated Value
Purchase Details
Closed on
Jan 22, 2019
Sold by
Hull Ralph Lewis
Bought by
Eph 2 Assets Llc
Purchase Details
Closed on
Jun 16, 2009
Sold by
Hud-Housing Of Urban Dev
Bought by
Hull Ralph L and Hull Helen F
Purchase Details
Closed on
Aug 5, 2008
Sold by
Wells Fargo Bk Na
Bought by
Hud-Housing Of Urban Dev
Purchase Details
Closed on
Jan 17, 2001
Sold by
Brymer Eileen P
Bought by
Peterman Nathan M and Peterman Marie N
Home Financials for this Owner
Home Financials are based on the most recent Mortgage that was taken out on this home.
Original Mortgage
$105,813
Interest Rate
7.18%
Mortgage Type
FHA
Create a Home Valuation Report for This Property
The Home Valuation Report is an in-depth analysis detailing your home's value as well as a comparison with similar homes in the area
Home Values in the Area
Average Home Value in this Area
Purchase History
| Date | Buyer | Sale Price | Title Company |
|---|---|---|---|
| Alto Asset Company 1 Llc | $125,915 | -- | |
| Eph 2 Assets Llc | $90,000 | -- | |
| Hull Ralph L | $45,000 | -- | |
| Hud-Housing Of Urban Dev | -- | -- | |
| Wells Fargo Bk Na | $109,529 | -- | |
| Peterman Nathan M | $106,900 | -- |
Source: Public Records
Mortgage History
| Date | Status | Borrower | Loan Amount |
|---|---|---|---|
| Previous Owner | Peterman Nathan M | $105,813 |
Source: Public Records
Tax History Compared to Growth
Tax History
| Year | Tax Paid | Tax Assessment Tax Assessment Total Assessment is a certain percentage of the fair market value that is determined by local assessors to be the total taxable value of land and additions on the property. | Land | Improvement |
|---|---|---|---|---|
| 2024 | $2,703 | $66,480 | $12,233 | $54,247 |
| 2023 | $2,770 | $66,480 | $12,233 | $54,247 |
| 2022 | $2,770 | $66,480 | $12,800 | $53,680 |
| 2021 | $2,271 | $54,600 | $8,960 | $45,640 |
| 2020 | $2,129 | $49,560 | $8,600 | $40,960 |
| 2019 | $1,359 | $29,880 | $4,680 | $25,200 |
| 2018 | $1,365 | $29,880 | $4,680 | $25,200 |
| 2017 | $1,242 | $26,920 | $4,680 | $22,240 |
| 2016 | $1,242 | $26,920 | $4,680 | $22,240 |
| 2015 | $1,397 | $30,280 | $4,680 | $25,600 |
| 2014 | $1,481 | $31,800 | $3,960 | $27,840 |
| 2013 | -- | $30,760 | $4,840 | $25,920 |
Source: Public Records
Map
Nearby Homes
- 693 Deering Rd SE
- 2717 Stanton Woods Dr SE
- 1920 Logan Ln
- 574 Almand Branch Rd SE Unit 1
- 2924 Raintree Dr SE
- 917 Curry Cir SE
- 2923 Raintree Dr SE
- 1813 Holmsey Cir
- 665 Huron Ct SE
- 1511 Hillside Dr SE
- 820 Bridgewater Way SE
- 2537 Lennox Rd SE
- 549 Greenview Ave SE
- 812 Raintree Way SE
- 2987 Landmark Dr SE
- 1508 Hillside Dr SE
- 2617 Laurel Woods Ln SE Unit 3
- 2910 Stanton Rd SE
- 726 Shoreline Trail SE
- 3021 Lakeridge Dr SE
- 750 Greenview Ave SE
- 689 Pine Ridge Trail SE
- 696 Almand Branch Rd SE
- 679 Pine Ridge Trail SE Unit 3
- 696 Almand Branch Rd SE
- 767 Greenview Ave SE
- 688 Almand Branch Rd SE
- 781 Greenview Ave SE
- 669 Pine Ridge Trail SE
- 747 Greenview Ave SE
- 659 Pine Ridge Trail SE Unit 3
- 680 Almand Branch Rd SE Unit 3
- 690 Pine Ridge Trail SE
- 689 Almand Branch Rd SE
- 791 Greenview Ave SE
- 680 Pine Ridge Trail SE
- 649 Pine Ridge Trail SE
- 727 Greenview Ave SE
- 672 Almand Branch Rd SE
- 670 Pine Ridge Trail SE