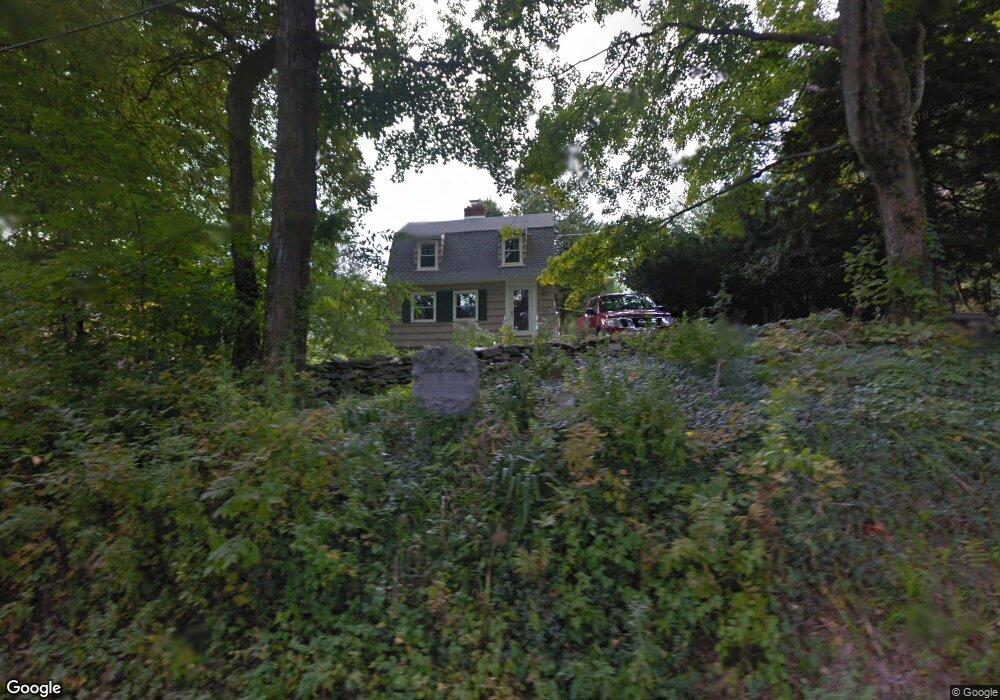
750 Klug Hill Rd Torrington, CT 06790
Estimated Value: $273,947 - $299,000
2
Beds
2
Baths
1,150
Sq Ft
$253/Sq Ft
Est. Value
About This Home
This home is located at 750 Klug Hill Rd, Torrington, CT 06790 and is currently estimated at $291,237, approximately $253 per square foot. 750 Klug Hill Rd is a home located in Litchfield County with nearby schools including Torrington Middle School, Torrington High School, and St. John Paul the Great Academy.
Ownership History
Date
Name
Owned For
Owner Type
Purchase Details
Closed on
Nov 25, 2020
Sold by
Genova Trista
Bought by
Shepherd Derald
Current Estimated Value
Home Financials for this Owner
Home Financials are based on the most recent Mortgage that was taken out on this home.
Original Mortgage
$176,739
Outstanding Balance
$157,631
Interest Rate
2.8%
Mortgage Type
FHA
Estimated Equity
$133,606
Purchase Details
Closed on
May 28, 2008
Sold by
West Bonnie J
Bought by
Genova Trista
Home Financials for this Owner
Home Financials are based on the most recent Mortgage that was taken out on this home.
Original Mortgage
$172,197
Interest Rate
5.91%
Mortgage Type
Purchase Money Mortgage
Purchase Details
Closed on
Jan 20, 1995
Sold by
Dubnanski David G
Bought by
West Robert P and Mackie Bonnie J
Purchase Details
Closed on
Jul 17, 1992
Sold by
Crown Katherine M
Bought by
Dubnanski David G
Create a Home Valuation Report for This Property
The Home Valuation Report is an in-depth analysis detailing your home's value as well as a comparison with similar homes in the area
Home Values in the Area
Average Home Value in this Area
Purchase History
| Date | Buyer | Sale Price | Title Company |
|---|---|---|---|
| Shepherd Derald | $180,000 | None Available | |
| Genova Trista | $174,950 | -- | |
| West Robert P | $124,000 | -- | |
| Dubnanski David G | $124,000 | -- |
Source: Public Records
Mortgage History
| Date | Status | Borrower | Loan Amount |
|---|---|---|---|
| Open | Shepherd Derald | $176,739 | |
| Previous Owner | Dubnanski David G | $163,100 | |
| Previous Owner | Dubnanski David G | $172,197 | |
| Previous Owner | Dubnanski David G | $105,000 | |
| Previous Owner | Dubnanski David G | $110,500 |
Source: Public Records
Tax History Compared to Growth
Tax History
| Year | Tax Paid | Tax Assessment Tax Assessment Total Assessment is a certain percentage of the fair market value that is determined by local assessors to be the total taxable value of land and additions on the property. | Land | Improvement |
|---|---|---|---|---|
| 2025 | $6,629 | $172,410 | $35,000 | $137,410 |
| 2024 | $5,224 | $108,910 | $35,000 | $73,910 |
| 2023 | $5,223 | $108,910 | $35,000 | $73,910 |
| 2022 | $5,134 | $108,910 | $35,000 | $73,910 |
| 2021 | $5,028 | $108,910 | $35,000 | $73,910 |
| 2020 | $5,028 | $108,910 | $35,000 | $73,910 |
| 2019 | $4,234 | $91,700 | $38,680 | $53,020 |
| 2018 | $5,175 | $112,080 | $38,680 | $73,400 |
| 2017 | $5,128 | $112,080 | $38,680 | $73,400 |
| 2016 | $5,128 | $112,080 | $38,680 | $73,400 |
| 2015 | $5,128 | $112,080 | $38,680 | $73,400 |
| 2014 | $5,073 | $139,670 | $62,530 | $77,140 |
Source: Public Records
Map
Nearby Homes
- 70 Greenfield Dr
- 103 Greenfield Dr
- 39 Baron Ln
- 68 Westledge Terrace
- 1739 Weed Rd
- 213 Spring St
- 1616 Weed Rd
- 271 Heights Dr
- 58 Eggleston St
- 650 Norfolk Rd
- 361 Heights Dr
- 79 Brass Mill Dam Rd
- 0 Highland Ave Unit 24088105
- 1657 Weed Rd
- 130 Oakbrook Ln
- 5 Zappulla Dr
- 111 Mill Ln
- 244 Hawthorne Terrace
- 206 Martha St
- 237 Wyoming Ave
- 710 Klug Hill Rd
- 768 Klug Hill Rd
- 98 Arel Dr
- 725 Klug Hill Rd
- 449 Westside Rd
- 131 Arel Dr
- 0 Westside Rd
- 00 Westside Rd
- 446 Westside Rd
- 805 Allen Rd
- 454 Westside Ln
- 404 Westside Rd
- 90 Orchard Ln
- 440 Westside Ln
- 68 Orchard Ln
- 386 Westside Rd
- 773 Allen Rd
- 422 Westside Ln
- 212 Westside Ln
- 466 Westside Ln