Estimated Value: $248,783 - $267,000
3
Beds
1
Bath
1,408
Sq Ft
$184/Sq Ft
Est. Value
About This Home
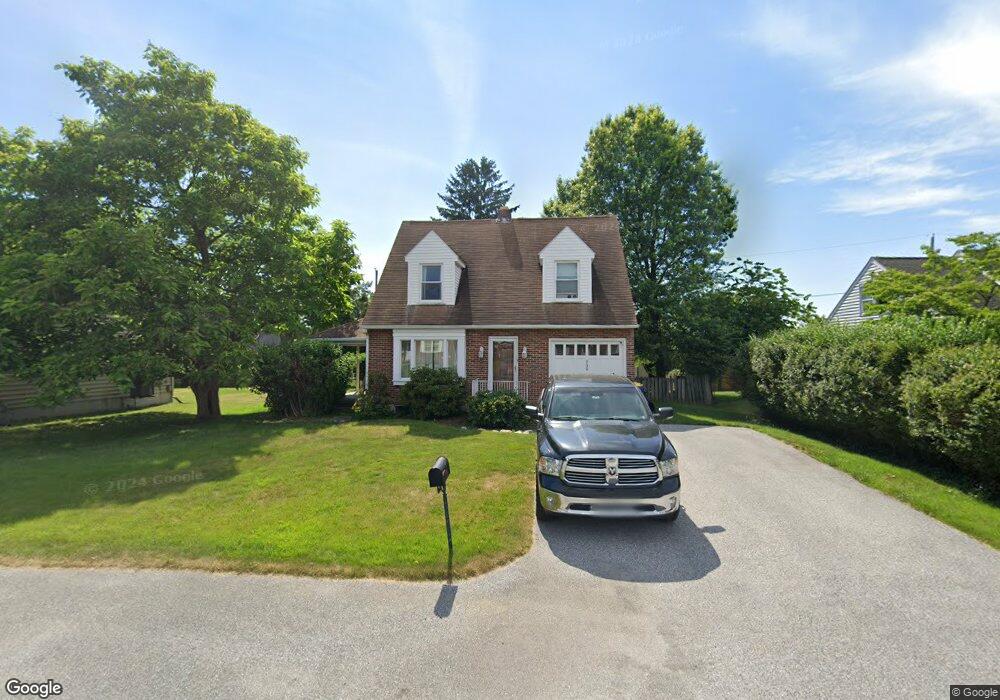
This home is located at 750 S Royal St, York, PA 17402 and is currently estimated at $259,446, approximately $184 per square foot. 750 S Royal St is a home located in York County with nearby schools including York Suburban Middle School, York Suburban Senior High School, and St Joseph School.
Ownership History
Date
Name
Owned For
Owner Type
Purchase Details
Closed on
Jun 30, 2017
Sold by
Scheuchenzuber James M and Scheuchenzuber Stephanie
Bought by
Spackman Trent D and Spackman Bridget M
Current Estimated Value
Home Financials for this Owner
Home Financials are based on the most recent Mortgage that was taken out on this home.
Original Mortgage
$151,210
Outstanding Balance
$125,143
Interest Rate
3.75%
Mortgage Type
FHA
Estimated Equity
$134,303
Purchase Details
Closed on
Oct 29, 2008
Sold by
Lucchesi Steven and Lucchesi Julie
Bought by
Scheuchenzuber James M
Home Financials for this Owner
Home Financials are based on the most recent Mortgage that was taken out on this home.
Original Mortgage
$164,009
Interest Rate
6.13%
Mortgage Type
FHA
Purchase Details
Closed on
Jan 18, 2007
Sold by
Bupp Timothy J and Estate Of Carol M Dorworth
Bought by
Lucchesi Steven
Purchase Details
Closed on
Oct 24, 2006
Sold by
Dorworth Carol M and Dorworth Charles E
Bought by
Dorworth Carol M and Dorworth Alice
Create a Home Valuation Report for This Property
The Home Valuation Report is an in-depth analysis detailing your home's value as well as a comparison with similar homes in the area
Home Values in the Area
Average Home Value in this Area
Purchase History
| Date | Buyer | Sale Price | Title Company |
|---|---|---|---|
| Spackman Trent D | $154,000 | None Available | |
| Scheuchenzuber James M | $164,900 | None Available | |
| Lucchesi Steven | $208,000 | None Available | |
| Dorworth Carol M | -- | None Available |
Source: Public Records
Mortgage History
| Date | Status | Borrower | Loan Amount |
|---|---|---|---|
| Open | Spackman Trent D | $151,210 | |
| Previous Owner | Scheuchenzuber James M | $164,009 |
Source: Public Records
Tax History Compared to Growth
Tax History
| Year | Tax Paid | Tax Assessment Tax Assessment Total Assessment is a certain percentage of the fair market value that is determined by local assessors to be the total taxable value of land and additions on the property. | Land | Improvement |
|---|---|---|---|---|
| 2025 | $3,360 | $96,040 | $28,530 | $67,510 |
| 2024 | $2,823 | $96,040 | $28,530 | $67,510 |
| 2023 | $3,193 | $96,040 | $28,530 | $67,510 |
| 2022 | $3,193 | $96,040 | $28,530 | $67,510 |
| 2021 | $3,056 | $96,040 | $28,530 | $67,510 |
| 2020 | $3,056 | $96,040 | $28,530 | $67,510 |
| 2019 | $2,947 | $96,040 | $28,530 | $67,510 |
| 2018 | $2,905 | $96,040 | $28,530 | $67,510 |
| 2017 | $2,815 | $96,040 | $28,530 | $67,510 |
| 2016 | $0 | $96,040 | $28,530 | $67,510 |
| 2015 | -- | $96,040 | $28,530 | $67,510 |
| 2014 | -- | $96,040 | $28,530 | $67,510 |
Source: Public Records
Map
Nearby Homes
- 741 S Russell St
- 500 S Kershaw St
- 350 S Royal St
- 2437 Schoolhouse Ln
- 1000 Sundale Dr
- 210 S Royal St
- 142 S Vernon St
- 2224 Eastern Blvd Unit B
- 1642 Mount Rose Ave
- 56 Jayme Dr Unit 9
- 1626 Mount Rose Ave
- 15 N Harlan St
- 101 N Vernon St
- 1447 4th Ave
- 2232 Dixie Dr
- 2764 Fairway Dr Unit 2764
- 114 N Rockburn St
- 2215 Dixie Dr
- 2559 Fairway Dr Unit 2559
- 108 N Oxford St
- 740 S Royal St
- 760 S Royal St
- 751 S Russell St
- 761 S Russell St
- 730 S Royal St
- 770 S Royal St
- 771 S Russell St
- 751 S Royal St
- 721 S Russell St
- 720 S Royal St
- 761 S Royal St
- 741 S Royal St
- 781 S Russell St
- 771 S Royal St
- 731 S Royal St
- 710 S Royal St
- 900 S Royal St
- 721 S Royal St
- 750 S Russell St
- 711 S Russell St