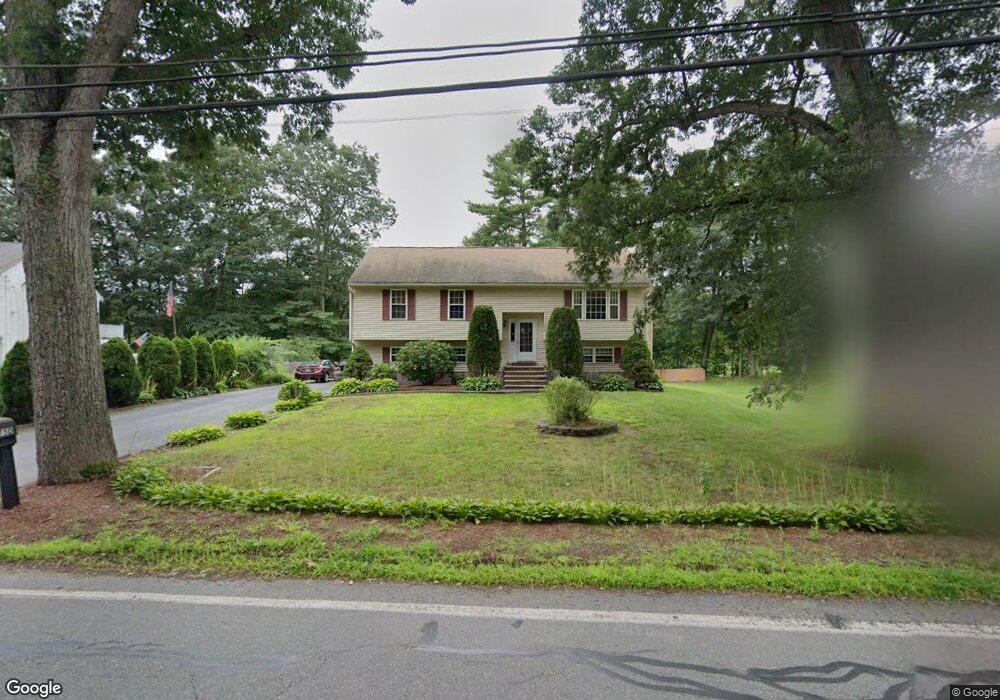
750 South St Tewksbury, MA 01876
Estimated Value: $692,648 - $846,000
3
Beds
2
Baths
2,364
Sq Ft
$327/Sq Ft
Est. Value
About This Home
This home is located at 750 South St, Tewksbury, MA 01876 and is currently estimated at $771,912, approximately $326 per square foot. 750 South St is a home located in Middlesex County with nearby schools including Heath-Brook Elementary School, John W. Wynn Middle School, and John F. Ryan Elementary School.
Ownership History
Date
Name
Owned For
Owner Type
Purchase Details
Closed on
Dec 18, 2006
Sold by
Bairos Elsa M and Bairos John S
Bought by
Abate Dennis and Abate Tamra
Current Estimated Value
Home Financials for this Owner
Home Financials are based on the most recent Mortgage that was taken out on this home.
Original Mortgage
$305,000
Outstanding Balance
$182,353
Interest Rate
6.31%
Mortgage Type
Purchase Money Mortgage
Estimated Equity
$589,559
Purchase Details
Closed on
May 1, 1995
Sold by
Db 95 Rt and Haskell David
Bought by
Bairos John S and Bairos Elsa
Home Financials for this Owner
Home Financials are based on the most recent Mortgage that was taken out on this home.
Original Mortgage
$100,000
Interest Rate
8.33%
Mortgage Type
Purchase Money Mortgage
Create a Home Valuation Report for This Property
The Home Valuation Report is an in-depth analysis detailing your home's value as well as a comparison with similar homes in the area
Home Values in the Area
Average Home Value in this Area
Purchase History
| Date | Buyer | Sale Price | Title Company |
|---|---|---|---|
| Abate Dennis | $410,000 | -- | |
| Bairos John S | $164,500 | -- |
Source: Public Records
Mortgage History
| Date | Status | Borrower | Loan Amount |
|---|---|---|---|
| Open | Abate Dennis | $305,000 | |
| Previous Owner | Bairos John S | $162,000 | |
| Previous Owner | Bairos John S | $104,000 | |
| Previous Owner | Bairos John S | $100,000 |
Source: Public Records
Tax History Compared to Growth
Tax History
| Year | Tax Paid | Tax Assessment Tax Assessment Total Assessment is a certain percentage of the fair market value that is determined by local assessors to be the total taxable value of land and additions on the property. | Land | Improvement |
|---|---|---|---|---|
| 2025 | $8,059 | $609,600 | $282,000 | $327,600 |
| 2024 | $7,760 | $579,500 | $268,700 | $310,800 |
| 2023 | $7,927 | $562,200 | $244,300 | $317,900 |
| 2022 | $7,486 | $492,500 | $212,400 | $280,100 |
| 2021 | $1,609 | $453,100 | $193,200 | $259,900 |
| 2020 | $7,008 | $438,800 | $183,900 | $254,900 |
| 2019 | $6,361 | $401,600 | $175,100 | $226,500 |
| 2018 | $6,026 | $373,600 | $175,100 | $198,500 |
| 2017 | $5,722 | $350,800 | $175,100 | $175,700 |
| 2016 | $5,510 | $337,000 | $175,100 | $161,900 |
| 2015 | $5,404 | $330,100 | $169,900 | $160,200 |
| 2014 | $5,086 | $315,700 | $169,900 | $145,800 |
Source: Public Records
Map
Nearby Homes