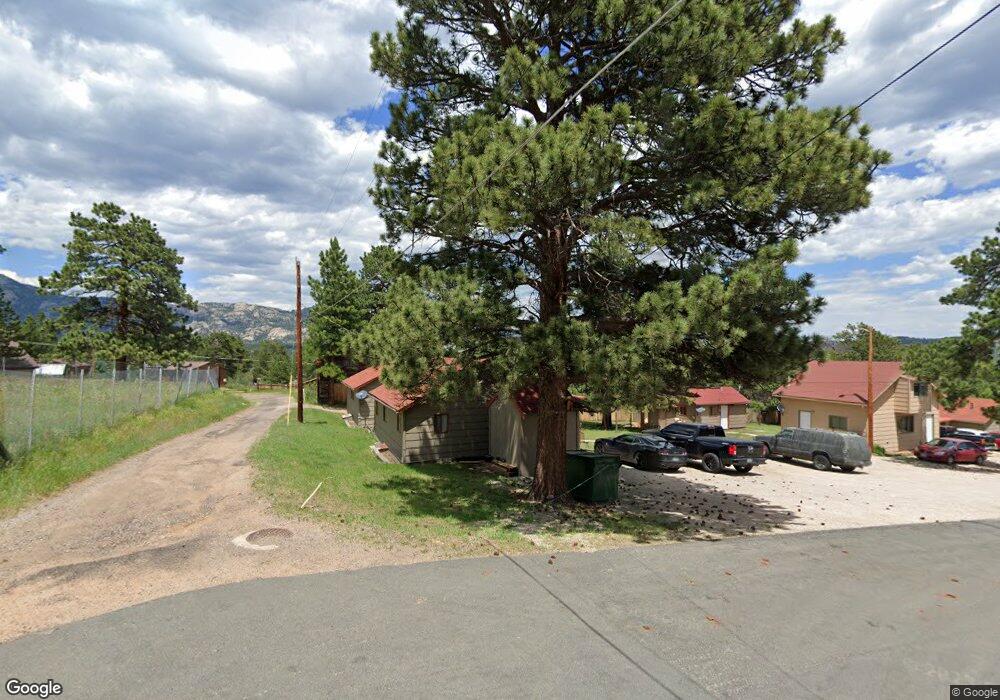
750 University Dr Estes Park, CO 80517
Estimated Value: $427,000 - $484,000
2
Beds
1
Bath
630
Sq Ft
$734/Sq Ft
Est. Value
About This Home
This home is located at 750 University Dr, Estes Park, CO 80517 and is currently estimated at $462,630, approximately $734 per square foot. 750 University Dr is a home located in Larimer County with nearby schools including Estes Park K-5 School, Estes Park Options School, and Estes Park Middle School.
Ownership History
Date
Name
Owned For
Owner Type
Purchase Details
Closed on
Sep 29, 2023
Sold by
Nuetzel Edith A
Bought by
Godsy Joseph
Current Estimated Value
Home Financials for this Owner
Home Financials are based on the most recent Mortgage that was taken out on this home.
Original Mortgage
$460,000
Outstanding Balance
$455,058
Interest Rate
7.09%
Mortgage Type
New Conventional
Estimated Equity
$7,572
Purchase Details
Closed on
May 21, 1999
Sold by
Lee Edward B and Lamb Robert E
Bought by
Nuetzel Edith A
Home Financials for this Owner
Home Financials are based on the most recent Mortgage that was taken out on this home.
Original Mortgage
$117,500
Interest Rate
6.91%
Purchase Details
Closed on
Jul 30, 1998
Sold by
Mcgovern Molly A
Bought by
Thompson Lucille B
Purchase Details
Closed on
Dec 1, 1992
Sold by
Thompson Lucille B
Bought by
Mcgovern John F
Create a Home Valuation Report for This Property
The Home Valuation Report is an in-depth analysis detailing your home's value as well as a comparison with similar homes in the area
Home Values in the Area
Average Home Value in this Area
Purchase History
| Date | Buyer | Sale Price | Title Company |
|---|---|---|---|
| Godsy Joseph | $460,000 | None Listed On Document | |
| Nuetzel Edith A | $132,500 | -- | |
| Thompson Lucille B | -- | -- | |
| Mcgovern John F | -- | -- |
Source: Public Records
Mortgage History
| Date | Status | Borrower | Loan Amount |
|---|---|---|---|
| Open | Godsy Joseph | $460,000 | |
| Previous Owner | Nuetzel Edith A | $117,500 |
Source: Public Records
Tax History Compared to Growth
Tax History
| Year | Tax Paid | Tax Assessment Tax Assessment Total Assessment is a certain percentage of the fair market value that is determined by local assessors to be the total taxable value of land and additions on the property. | Land | Improvement |
|---|---|---|---|---|
| 2025 | $1,665 | $26,411 | $12,462 | $13,949 |
| 2024 | $1,154 | $26,411 | $12,462 | $13,949 |
| 2022 | $1,118 | $21,587 | $8,340 | $13,247 |
| 2021 | $1,148 | $22,208 | $8,580 | $13,628 |
| 2020 | $427 | $11,069 | $6,793 | $4,276 |
| 2019 | $425 | $11,069 | $6,793 | $4,276 |
| 2018 | $593 | $14,695 | $6,480 | $8,215 |
| 2017 | $596 | $14,695 | $6,480 | $8,215 |
| 2016 | $980 | $13,046 | $7,164 | $5,882 |
| 2015 | $990 | $14,160 | $7,160 | $7,000 |
| 2014 | $795 | $10,750 | $7,800 | $2,950 |
Source: Public Records
Map
Nearby Homes
- 654 Morgan St
- 659 Morgan St
- 603 Aspen Ave Unit B4
- 603 Aspen Ave Unit C1
- 517 Birch Ave
- 1059 Lexington Ln
- 850 Shady Ln
- 910 Shady Ln
- TBD Stanley Ave
- 1013 Lexington Ln
- 1026 Lexington Ln
- 435 Columbine Ave
- 704 Birdie Ln Unit 17
- 734 Birdie Ln Unit 15
- 500 Elm Ave
- 1050 S Saint Vrain Ave Unit 1
- 635 Community Dr
- 404 Elm Ave
- 261 South Ct
- 1422 Matthew Cir Unit 2
- 920 Morgan St
- 921 University Dr Unit 3
- 921 University Dr Unit 46
- 921 University Dr Unit 2
- 921 University Dr Unit 1
- 921 University Dr
- 921 University Dr Unit 1-6
- 910 Morgan St
- 940 Morgan St
- 941 University Dr
- 850 Morgan St
- 751 University Dr
- 820 University Dr
- 930 University Dr
- 931 Morgan St
- 921 Morgan St
- 821 University Dr
- 951 University Dr
- 823 University Dr
- 830 Morgan St