Estimated Value: $602,000 - $851,000
4
Beds
3
Baths
3,332
Sq Ft
$213/Sq Ft
Est. Value
About This Home
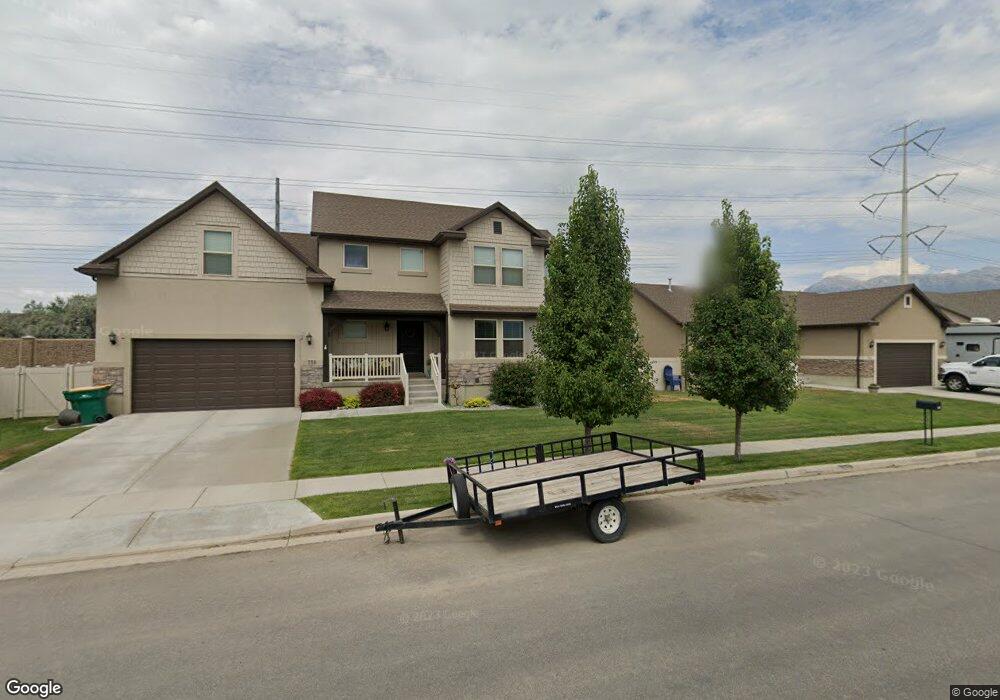
This home is located at 750 W 1250 S Unit 50, Lehi, UT 84043 and is currently estimated at $711,350, approximately $213 per square foot. 750 W 1250 S Unit 50 is a home located in Utah County with nearby schools including Dry Creek Elementary School, Willowcreek Middle School, and Lehi High School.
Ownership History
Date
Name
Owned For
Owner Type
Purchase Details
Closed on
Jun 13, 2016
Sold by
Ford Kevin E and Ford Kyla
Bought by
Grey Brian W and Grey Tamara
Current Estimated Value
Purchase Details
Closed on
Mar 18, 2013
Sold by
Ford Kevin E
Bought by
Ford Kevin E and Ford Kyla
Home Financials for this Owner
Home Financials are based on the most recent Mortgage that was taken out on this home.
Original Mortgage
$227,900
Interest Rate
3.53%
Mortgage Type
New Conventional
Purchase Details
Closed on
Dec 5, 2008
Sold by
Dubois Enterprises Inc
Bought by
Utah Development Of Transportation
Create a Home Valuation Report for This Property
The Home Valuation Report is an in-depth analysis detailing your home's value as well as a comparison with similar homes in the area
Home Values in the Area
Average Home Value in this Area
Purchase History
| Date | Buyer | Sale Price | Title Company |
|---|---|---|---|
| Grey Brian W | -- | Traverse Title Ins Agency | |
| Ford Kevin E | -- | Affiliated First Title Co | |
| Ford Kevin E | -- | Affiliated First Title Co | |
| Utah Development Of Transportation | -- | Executive Title |
Source: Public Records
Mortgage History
| Date | Status | Borrower | Loan Amount |
|---|---|---|---|
| Previous Owner | Ford Kevin E | $227,900 |
Source: Public Records
Tax History Compared to Growth
Tax History
| Year | Tax Paid | Tax Assessment Tax Assessment Total Assessment is a certain percentage of the fair market value that is determined by local assessors to be the total taxable value of land and additions on the property. | Land | Improvement |
|---|---|---|---|---|
| 2025 | $2,695 | $351,395 | $210,500 | $428,400 |
| 2024 | $2,695 | $315,425 | $0 | $0 |
| 2023 | $2,542 | $323,015 | $0 | $0 |
| 2022 | $2,759 | $339,900 | $0 | $0 |
| 2021 | $2,505 | $466,600 | $121,800 | $344,800 |
| 2020 | $2,363 | $435,000 | $112,800 | $322,200 |
| 2019 | $2,100 | $401,800 | $112,800 | $289,000 |
| 2018 | $2,093 | $378,600 | $110,100 | $268,500 |
| 2017 | $1,925 | $185,185 | $0 | $0 |
| 2016 | $1,819 | $162,360 | $0 | $0 |
| 2015 | $1,721 | $161,095 | $0 | $0 |
| 2014 | $1,665 | $155,320 | $0 | $0 |
Source: Public Records
Map
Nearby Homes
- 1812 N Lake Rd
- 911 S Chappel Valley Loop
- 798 S 925 W
- 743 S 560 W
- 772 W 700 S
- 672 S 780 W
- 652 S 500 W
- 736 S 300 W
- 817 S 1365 W
- 669 S 1250 W
- 1351 W 700 St S
- 1204 S 50 E Unit 1
- 77 N Richmond Ln
- Adagio Plan at Grandeur Estates
- Ballad Plan at Grandeur Estates
- Interlude Plan at Grandeur Estates
- Trio Plan at Grandeur Estates
- Forte Plan at Grandeur Estates
- Tenor Plan at Grandeur Estates
- Staccato Plan at Grandeur Estates
- 750 W 1250 S Unit 750
- 734 W 1250 S Unit 51
- 766 W 1250 S Unit 49
- 766 W 1250 S
- 1231 S 780 W Unit 38
- 718 W 1250 S Unit 52
- 718 W 1250 S
- 782 W 1250 S Unit 48
- 782 W 1250 S
- 1242 S 720 W Unit 37
- 1224 S 780 W
- 692 W 1250 S Unit 53
- 692 W 1250 S
- 1253 S 780 W Unit 39
- 796 W 1250 S Unit 47
- 796 W 1250 S
- 1240 S 780 W
- 1264 S 720 W
- 745 W 1100 S
- 678 W 1250 S