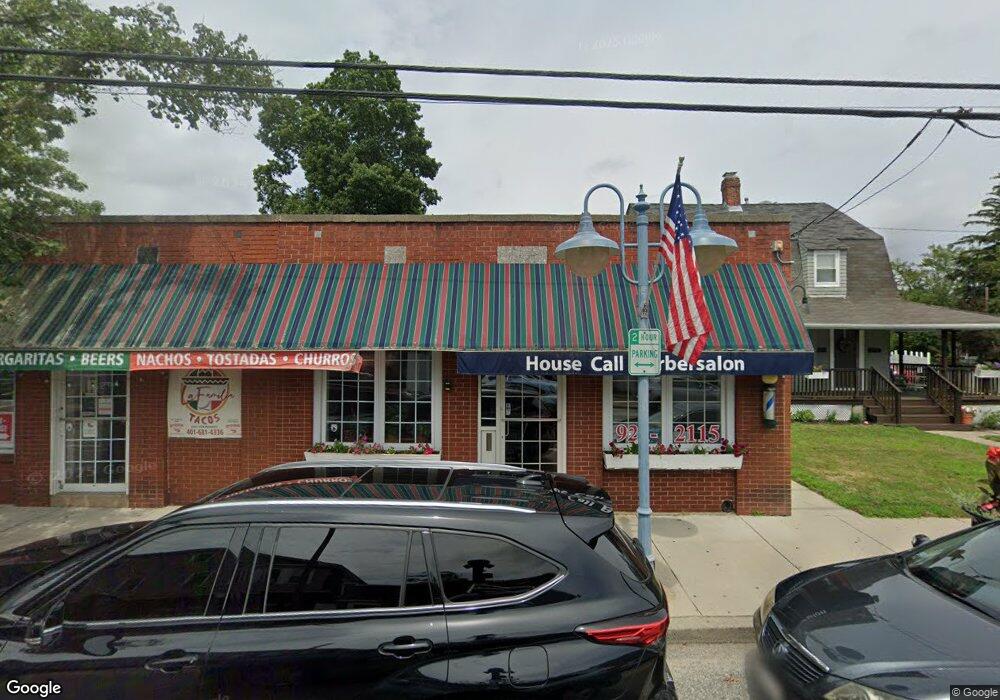
750 W Shore Rd Warwick, RI 02889
Conimicut-Shawomet NeighborhoodEstimated Value: $676,319
--
Bed
--
Bath
3,523
Sq Ft
$192/Sq Ft
Est. Value
About This Home
This home is located at 750 W Shore Rd, Warwick, RI 02889 and is currently estimated at $676,319, approximately $191 per square foot. 750 W Shore Rd is a home located in Kent County with nearby schools including Saint Kevin School and Bishop Hendricken High School.
Ownership History
Date
Name
Owned For
Owner Type
Purchase Details
Closed on
Aug 21, 2023
Sold by
139 School St Rt and Roache
Bought by
Lees Jonathan and Lees Amanda
Current Estimated Value
Home Financials for this Owner
Home Financials are based on the most recent Mortgage that was taken out on this home.
Original Mortgage
$390,000
Outstanding Balance
$381,113
Interest Rate
6.81%
Mortgage Type
Commercial
Estimated Equity
$295,206
Purchase Details
Closed on
Jul 28, 2020
Sold by
Tremblay Paul M
Bought by
Roache Peter and Fernandes Kevin
Purchase Details
Closed on
Mar 23, 1998
Sold by
Milone Anthony and Milone Catherine
Bought by
Tremblay Paul M
Home Financials for this Owner
Home Financials are based on the most recent Mortgage that was taken out on this home.
Original Mortgage
$73,000
Interest Rate
6.92%
Mortgage Type
Commercial
Create a Home Valuation Report for This Property
The Home Valuation Report is an in-depth analysis detailing your home's value as well as a comparison with similar homes in the area
Home Values in the Area
Average Home Value in this Area
Purchase History
| Date | Buyer | Sale Price | Title Company |
|---|---|---|---|
| Lees Jonathan | $560,000 | None Available | |
| Lees Jonathan | $560,000 | None Available | |
| Roache Peter | $399,999 | None Available | |
| Roache Peter | $399,999 | None Available | |
| Tremblay Paul M | $109,000 | -- | |
| Tremblay Paul M | $109,000 | -- |
Source: Public Records
Mortgage History
| Date | Status | Borrower | Loan Amount |
|---|---|---|---|
| Open | Lees Jonathan | $390,000 | |
| Closed | Lees Jonathan | $390,000 | |
| Previous Owner | Tremblay Paul M | $73,000 |
Source: Public Records
Tax History Compared to Growth
Tax History
| Year | Tax Paid | Tax Assessment Tax Assessment Total Assessment is a certain percentage of the fair market value that is determined by local assessors to be the total taxable value of land and additions on the property. | Land | Improvement |
|---|---|---|---|---|
| 2024 | -- | $461,700 | $102,100 | $359,600 |
| 2023 | $0 | $461,700 | $102,100 | $359,600 |
| 2022 | $0 | $348,500 | $87,500 | $261,000 |
| 2021 | $0 | $348,500 | $87,500 | $261,000 |
| 2020 | $0 | $348,500 | $87,500 | $261,000 |
| 2019 | $0 | $346,900 | $87,500 | $259,400 |
| 2018 | $7,833 | $257,400 | $87,500 | $169,900 |
| 2017 | $0 | $257,400 | $87,500 | $169,900 |
| 2016 | -- | $258,200 | $87,500 | $170,700 |
| 2015 | -- | $277,900 | $89,800 | $188,100 |
| 2014 | -- | $277,900 | $89,800 | $188,100 |
| 2013 | -- | $277,900 | $89,800 | $188,100 |
Source: Public Records
Map
Nearby Homes