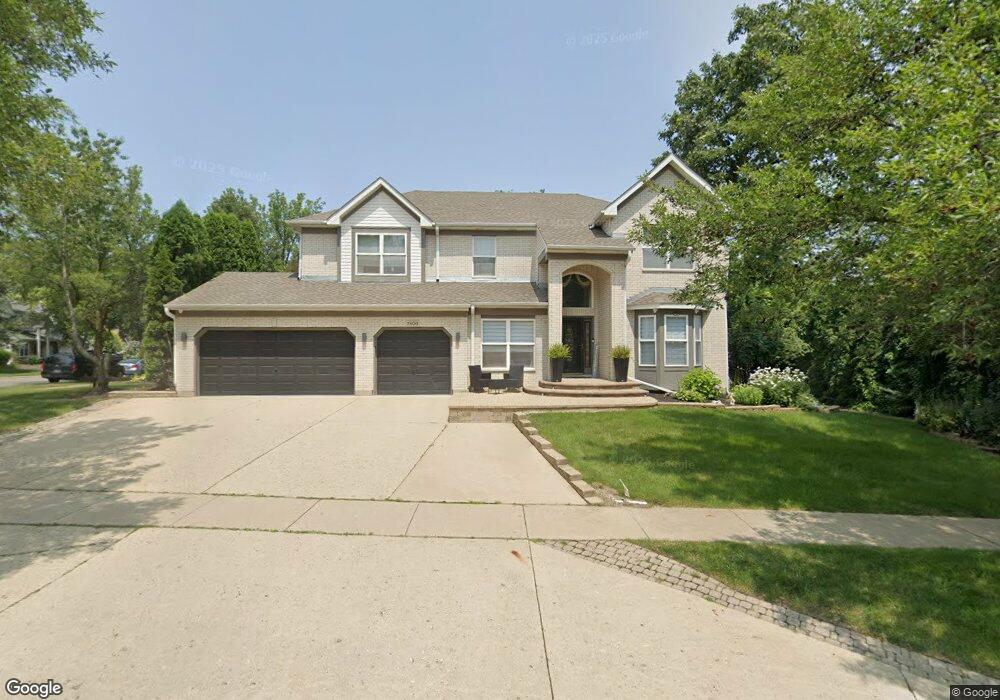
7500 Cascade Way Gurnee, IL 60031
Estimated Value: $613,000 - $657,000
4
Beds
3
Baths
3,617
Sq Ft
$176/Sq Ft
Est. Value
About This Home
This home is located at 7500 Cascade Way, Gurnee, IL 60031 and is currently estimated at $635,205, approximately $175 per square foot. 7500 Cascade Way is a home located in Lake County with nearby schools including Woodland Primary School, Woodland Elementary School, and Woodland Intermediate School.
Ownership History
Date
Name
Owned For
Owner Type
Purchase Details
Closed on
Oct 2, 2025
Sold by
Giannakakis Emmanuel V
Bought by
Emmanuel V Giannakakis Family Trust and Giannakakis
Current Estimated Value
Purchase Details
Closed on
Apr 4, 2011
Sold by
Giannakakis Emmanuel
Bought by
Giannakakis Emmanuel V
Home Financials for this Owner
Home Financials are based on the most recent Mortgage that was taken out on this home.
Original Mortgage
$293,000
Interest Rate
4.92%
Mortgage Type
New Conventional
Purchase Details
Closed on
Mar 4, 1999
Sold by
Cole Taylor Bank
Bought by
Giannakakis Emmanuel and Giannakakis Anastasia
Home Financials for this Owner
Home Financials are based on the most recent Mortgage that was taken out on this home.
Original Mortgage
$265,000
Interest Rate
7.5%
Create a Home Valuation Report for This Property
The Home Valuation Report is an in-depth analysis detailing your home's value as well as a comparison with similar homes in the area
Home Values in the Area
Average Home Value in this Area
Purchase History
| Date | Buyer | Sale Price | Title Company |
|---|---|---|---|
| Emmanuel V Giannakakis Family Trust | -- | None Listed On Document | |
| Giannakakis Emmanuel V | -- | First American Title | |
| Giannakakis Emmanuel | $304,000 | -- |
Source: Public Records
Mortgage History
| Date | Status | Borrower | Loan Amount |
|---|---|---|---|
| Previous Owner | Giannakakis Emmanuel V | $293,000 | |
| Previous Owner | Giannakakis Emmanuel | $265,000 |
Source: Public Records
Tax History
| Year | Tax Paid | Tax Assessment Tax Assessment Total Assessment is a certain percentage of the fair market value that is determined by local assessors to be the total taxable value of land and additions on the property. | Land | Improvement |
|---|---|---|---|---|
| 2024 | $14,541 | $179,923 | $30,154 | $149,769 |
| 2023 | $13,382 | $155,970 | $26,140 | $129,830 |
| 2022 | $13,382 | $143,285 | $26,147 | $117,138 |
| 2021 | $12,101 | $137,536 | $25,098 | $112,438 |
| 2020 | $11,714 | $134,155 | $24,481 | $109,674 |
| 2019 | $11,382 | $130,260 | $23,770 | $106,490 |
| 2018 | $12,679 | $144,678 | $32,430 | $112,248 |
| 2017 | $12,418 | $140,533 | $31,501 | $109,032 |
| 2016 | $12,330 | $134,275 | $30,098 | $104,177 |
| 2015 | $12,021 | $127,347 | $28,545 | $98,802 |
| 2014 | $11,555 | $123,492 | $28,153 | $95,339 |
| 2012 | $10,944 | $124,438 | $28,369 | $96,069 |
Source: Public Records
Map
Nearby Homes
- 767 Aster Dr
- 597 Treetop Ln
- 528 Cliffwood Ln
- 7449 Brentwood Ln
- 415 Kingsport Dr
- 7390 Bittersweet Dr
- 7421 Prescott Ln
- 1107 Vineyard Dr
- 575 Capital Ln
- 498 Capital Ln
- 1094 Vista Dr
- 1158 Vista Dr
- 7663 Gamay Ct
- 968 Knowles Rd
- 34439 N Saddle Ln
- 34271 N Tangueray Dr
- 6930 Bennington Dr
- 18238 W Gages Lake Rd
- 34115 N Wooded Glen Dr
- 34326 N Birch Ln Unit 15E
- 665 Strawberry Fields
- 650 Aster Dr
- 7522 Cascade Way
- 7499 Cascade Way
- 662 Aster Dr
- 7515 Cascade Way
- 681 Strawberry Fields
- 664 Strawberry Fields
- 7531 Cascade Way
- 674 Aster Dr
- 7540 Cascade Way
- 697 Strawberry Fields
- 680 Strawberry Fields
- 7453 Cascade Way
- 7547 Cascade Way
- 659 Aster Dr
- 686 Aster Dr
- 713 Strawberry Fields
- 696 Strawberry Fields
- 7441 Cascade Way
Your Personal Tour Guide
Ask me questions while you tour the home.