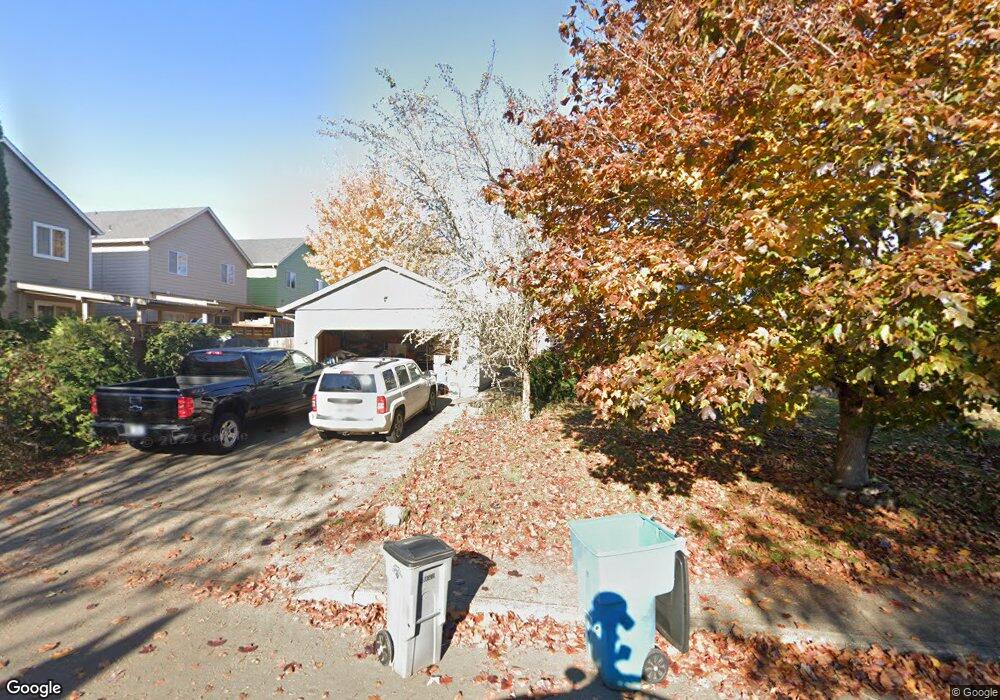
7502 NE 55th St Vancouver, WA 98662
Minnehaha NeighborhoodEstimated Value: $428,000 - $453,000
3
Beds
2
Baths
1,300
Sq Ft
$341/Sq Ft
Est. Value
About This Home
This home is located at 7502 NE 55th St, Vancouver, WA 98662 and is currently estimated at $443,475, approximately $341 per square foot. 7502 NE 55th St is a home located in Clark County with nearby schools including Walnut Grove Elementary, Gaiser Middle School, and Fort Vancouver High School.
Ownership History
Date
Name
Owned For
Owner Type
Purchase Details
Closed on
Oct 10, 2011
Sold by
Colemansmith Gary
Bought by
Garrett John Michael
Current Estimated Value
Home Financials for this Owner
Home Financials are based on the most recent Mortgage that was taken out on this home.
Original Mortgage
$153,225
Outstanding Balance
$104,757
Interest Rate
4.15%
Mortgage Type
VA
Estimated Equity
$338,718
Purchase Details
Closed on
Aug 17, 2011
Sold by
Corredor David J
Bought by
Colemansmith Gary
Home Financials for this Owner
Home Financials are based on the most recent Mortgage that was taken out on this home.
Original Mortgage
$153,225
Outstanding Balance
$104,757
Interest Rate
4.15%
Mortgage Type
VA
Estimated Equity
$338,718
Purchase Details
Closed on
May 21, 1997
Sold by
Ertel Kenneth R and Ertel Cindy
Bought by
Corredor David J
Home Financials for this Owner
Home Financials are based on the most recent Mortgage that was taken out on this home.
Original Mortgage
$115,800
Interest Rate
8.14%
Create a Home Valuation Report for This Property
The Home Valuation Report is an in-depth analysis detailing your home's value as well as a comparison with similar homes in the area
Home Values in the Area
Average Home Value in this Area
Purchase History
| Date | Buyer | Sale Price | Title Company |
|---|---|---|---|
| Garrett John Michael | $150,000 | Fidelity National Title | |
| Colemansmith Gary | $113,500 | None Available | |
| Corredor David J | $121,900 | Chicago Title Insurance Co |
Source: Public Records
Mortgage History
| Date | Status | Borrower | Loan Amount |
|---|---|---|---|
| Open | Garrett John Michael | $153,225 | |
| Previous Owner | Corredor David J | $115,800 |
Source: Public Records
Tax History Compared to Growth
Tax History
| Year | Tax Paid | Tax Assessment Tax Assessment Total Assessment is a certain percentage of the fair market value that is determined by local assessors to be the total taxable value of land and additions on the property. | Land | Improvement |
|---|---|---|---|---|
| 2025 | $3,889 | $404,369 | $179,800 | $224,569 |
| 2024 | $3,716 | $397,056 | $179,800 | $217,256 |
| 2023 | $3,609 | $395,706 | $179,800 | $215,906 |
| 2022 | $3,349 | $385,819 | $179,800 | $206,019 |
| 2021 | $3,009 | $333,514 | $155,000 | $178,514 |
| 2020 | $2,751 | $282,367 | $113,750 | $168,617 |
| 2019 | $2,534 | $266,796 | $99,450 | $167,346 |
| 2018 | $2,716 | $255,378 | $0 | $0 |
| 2017 | $2,505 | $225,823 | $0 | $0 |
| 2016 | $2,420 | $210,410 | $0 | $0 |
| 2015 | $2,363 | $188,691 | $0 | $0 |
| 2014 | -- | $173,474 | $0 | $0 |
| 2013 | -- | $154,088 | $0 | $0 |
Source: Public Records
Map
Nearby Homes
- 5317 NE 75th Ave Unit 50
- 7509 NE 53rd St
- 5226 NE 74th Ct
- 7501 NE 51st Way
- 5809 NE 71st Ave
- 5700 NE 82nd Ave Unit C15
- 5700 NE 82nd Ave Unit 32F
- 5812 NE 80th Ct
- 5301 NE 68th Ave
- 6705 NE 55th St
- 5313 NE 66th Ave Unit C30
- 5313 NE 66th Ave Unit B15
- 7509 NE Vancouver Mall Dr Unit D16
- 7006 NE 61st St
- 6016 NE 81st Ave
- 8015 NE 61st St
- 4701 NE 77th Ave Unit E-20
- 4701 NE 77th Ave Unit 36
- 5333 NE 83rd Place
- 5409 NE 66th Ave
- 7506 NE 55th St
- 5505 NE 74th Ct
- 7428 NE 55th St
- 5501 NE 74th Ct
- 5509 NE 74th Ct
- 5513 NE 74th Ct
- 7503 NE 56th St
- 7507 NE 56th St
- 7510 NE 55th St
- 7441 NE 56th St
- 7437 NE 56th St
- 7431 NE 55th St
- 7433 NE 56th St
- 7429 NE 56th St
- 7511 NE 56th St
- 7427 NE 55th St
- 7425 NE 56th St
- 7423 NE 55th St
- 5504 NE 74th Ct
- 5500 NE 74th Ct