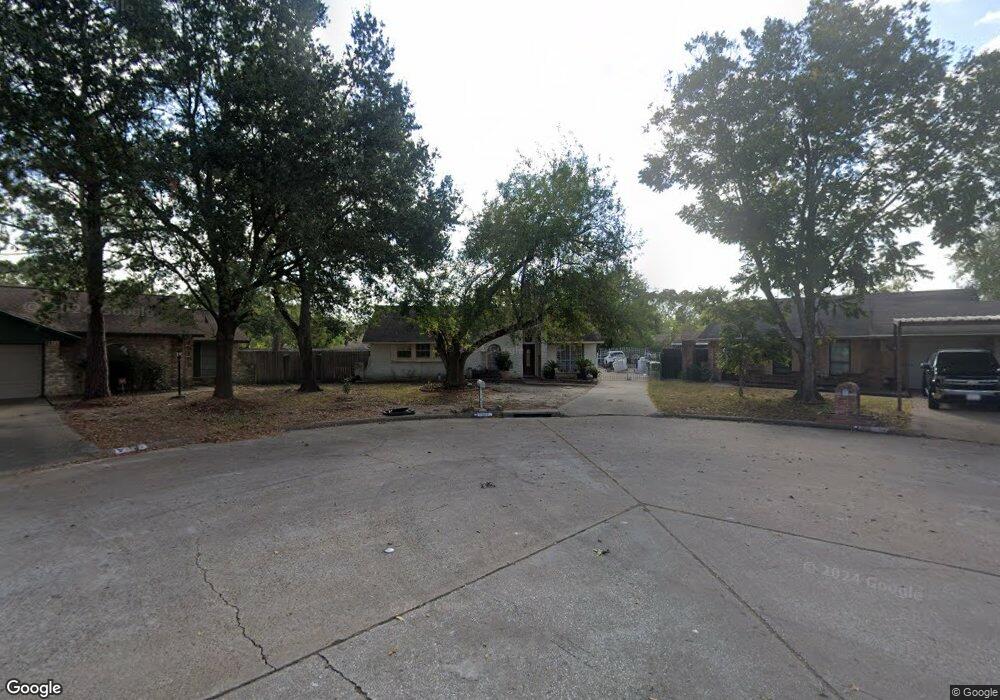
7503 Lumber Jack Dr Houston, TX 77040
Greater Inwood NeighborhoodEstimated Value: $221,000 - $243,000
4
Beds
2
Baths
1,460
Sq Ft
$158/Sq Ft
Est. Value
About This Home
This home is located at 7503 Lumber Jack Dr, Houston, TX 77040 and is currently estimated at $230,958, approximately $158 per square foot. 7503 Lumber Jack Dr is a home located in Harris County with nearby schools including Edward a Vines EC/Pre-K/K School, Ermel Elementary School, and Dr. Viola K. Garcia Middle School.
Ownership History
Date
Name
Owned For
Owner Type
Purchase Details
Closed on
Jun 25, 2010
Sold by
Fannie Mae
Bought by
Guzman Nelida and Lopez Arturo
Current Estimated Value
Purchase Details
Closed on
Jan 5, 2010
Sold by
Sixtos Sylvia and Sixtos Felipe
Bought by
Federal National Mortgage Association
Purchase Details
Closed on
Jan 21, 2004
Sold by
Bonilla Fernando A and Zometa Isidra D
Bought by
Sixtos Felipe
Home Financials for this Owner
Home Financials are based on the most recent Mortgage that was taken out on this home.
Original Mortgage
$84,000
Interest Rate
5.9%
Mortgage Type
Purchase Money Mortgage
Purchase Details
Closed on
Jun 22, 1999
Sold by
Nunez Jaime Arturo and Nunez Anita Louise
Bought by
Bonilla Fernando A and Zometa Isidra D
Home Financials for this Owner
Home Financials are based on the most recent Mortgage that was taken out on this home.
Original Mortgage
$76,361
Interest Rate
7.11%
Mortgage Type
FHA
Create a Home Valuation Report for This Property
The Home Valuation Report is an in-depth analysis detailing your home's value as well as a comparison with similar homes in the area
Home Values in the Area
Average Home Value in this Area
Purchase History
| Date | Buyer | Sale Price | Title Company |
|---|---|---|---|
| Guzman Nelida | -- | Star Tex Title Company 04 | |
| Federal National Mortgage Association | $89,845 | None Available | |
| Sixtos Felipe | -- | Startex Title Company | |
| Bonilla Fernando A | -- | First American Title |
Source: Public Records
Mortgage History
| Date | Status | Borrower | Loan Amount |
|---|---|---|---|
| Previous Owner | Sixtos Felipe | $84,000 | |
| Previous Owner | Bonilla Fernando A | $76,361 | |
| Closed | Sixtos Felipe | $21,000 |
Source: Public Records
Tax History Compared to Growth
Tax History
| Year | Tax Paid | Tax Assessment Tax Assessment Total Assessment is a certain percentage of the fair market value that is determined by local assessors to be the total taxable value of land and additions on the property. | Land | Improvement |
|---|---|---|---|---|
| 2025 | $3,628 | $221,402 | $46,676 | $174,726 |
| 2024 | $3,628 | $215,791 | $44,453 | $171,338 |
| 2023 | $3,628 | $213,829 | $44,453 | $169,376 |
| 2022 | $3,818 | $176,510 | $37,785 | $138,725 |
| 2021 | $3,634 | $155,094 | $37,785 | $117,309 |
| 2020 | $3,472 | $145,264 | $18,522 | $126,742 |
| 2019 | $3,309 | $134,299 | $18,522 | $115,777 |
| 2018 | $1,381 | $117,617 | $18,522 | $99,095 |
| 2017 | $2,622 | $117,617 | $18,522 | $99,095 |
| 2016 | $2,383 | $103,274 | $18,522 | $84,752 |
| 2015 | $1,783 | $97,014 | $18,522 | $78,492 |
| 2014 | $1,783 | $74,507 | $18,522 | $55,985 |
Source: Public Records
Map
Nearby Homes
- 7606 Battlepine Dr
- 7707 Lumber Jack Dr
- 7803 Yellow Pine Dr
- 7322 Sawmill Trail
- 7727 Log Hollow Dr
- 7410 Log Hollow Dr
- 7823 Lumber Jack Dr
- 7210 Lumber Jack Dr
- 7706 Deadwood Dr
- 7731 Deadwood Dr
- 9523 Vanwood St
- 7911 Battleoak Dr
- 10126 Pine Moss Dr
- 7918 Battleoak Dr
- 7706 Cloverlake Ct
- 10515 Ince Ln
- 7051 Majestic Oaks Dr
- 10143 Inwood Hollow Ln
- 9331 Deanwood St
- 8006 Summer Trail Dr
- 10102 Hannon Dr
- 7507 Lumber Jack Dr
- 7502 Woodsman Trail
- 7506 Woodsman Trail
- 10106 Hannon Dr
- 7511 Lumber Jack Dr
- 7510 Woodsman Trail
- 7514 Woodsman Trail
- 10110 Hannon Dr
- 7515 Lumber Jack Dr
- 7510 Lumber Jack Dr
- 7518 Woodsman Trail
- 7514 Lumber Jack Dr
- 7603 Lumber Jack Dr
- 7426 Lumber Jack Dr
- 10114 Hannon Dr
- 10111 Hannon Dr
- 7414 Woodsman Trail
- 7423 Lumber Jack Dr
- 7602 Woodsman Trail