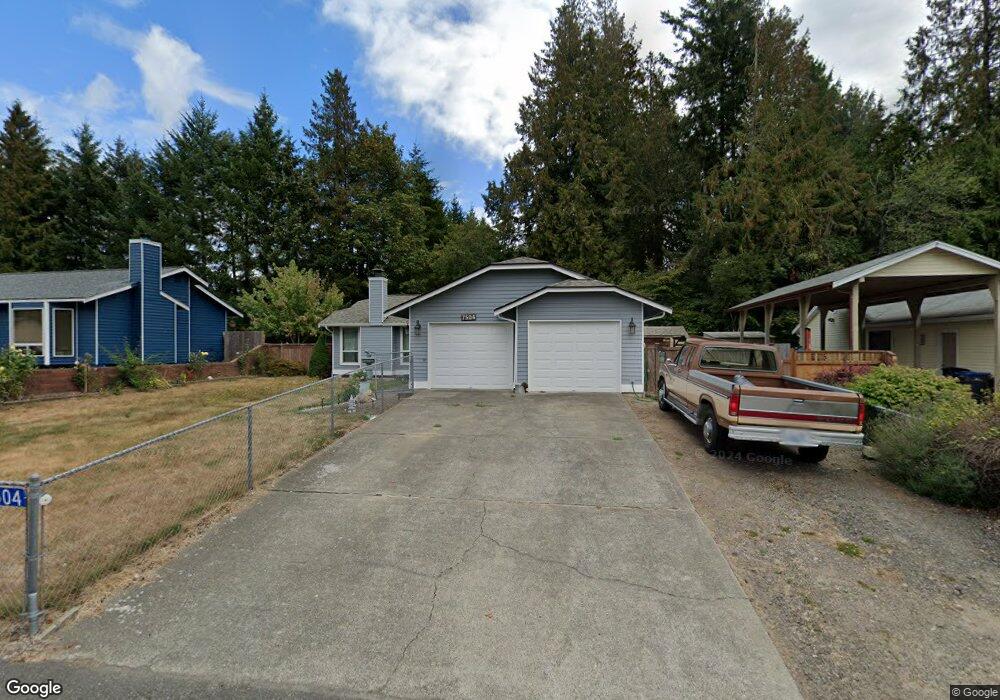
7504 Blackbird Dr NE Bremerton, WA 98311
Estimated Value: $432,000 - $445,000
3
Beds
2
Baths
1,205
Sq Ft
$364/Sq Ft
Est. Value
About This Home
This home is located at 7504 Blackbird Dr NE, Bremerton, WA 98311 and is currently estimated at $439,070, approximately $364 per square foot. 7504 Blackbird Dr NE is a home located in Kitsap County with nearby schools including Woodlands Elementary School, Fairview Middle School, and Olympic High School.
Ownership History
Date
Name
Owned For
Owner Type
Purchase Details
Closed on
Jun 22, 2015
Sold by
Jacques Lori A
Bought by
Andrews Stephen and Jacques Megan
Current Estimated Value
Home Financials for this Owner
Home Financials are based on the most recent Mortgage that was taken out on this home.
Original Mortgage
$162,800
Outstanding Balance
$126,362
Interest Rate
3.81%
Mortgage Type
New Conventional
Estimated Equity
$312,708
Purchase Details
Closed on
Mar 24, 2010
Sold by
Jacques Gary L
Bought by
Jacques Lori A
Purchase Details
Closed on
Aug 13, 1996
Sold by
Jacques Lori A and Heath Lori A
Bought by
Jacques Gary L and Jacques Lori A
Home Financials for this Owner
Home Financials are based on the most recent Mortgage that was taken out on this home.
Original Mortgage
$75,000
Interest Rate
8.18%
Create a Home Valuation Report for This Property
The Home Valuation Report is an in-depth analysis detailing your home's value as well as a comparison with similar homes in the area
Home Values in the Area
Average Home Value in this Area
Purchase History
| Date | Buyer | Sale Price | Title Company |
|---|---|---|---|
| Andrews Stephen | $160,000 | Pacific Nw Title | |
| Jacques Lori A | -- | None Available | |
| Jacques Gary L | -- | Transnation Title Insurance |
Source: Public Records
Mortgage History
| Date | Status | Borrower | Loan Amount |
|---|---|---|---|
| Open | Andrews Stephen | $162,800 | |
| Previous Owner | Jacques Gary L | $75,000 |
Source: Public Records
Tax History Compared to Growth
Tax History
| Year | Tax Paid | Tax Assessment Tax Assessment Total Assessment is a certain percentage of the fair market value that is determined by local assessors to be the total taxable value of land and additions on the property. | Land | Improvement |
|---|---|---|---|---|
| 2026 | $3,526 | $370,120 | $99,140 | $270,980 |
| 2025 | $3,526 | $370,120 | $99,140 | $270,980 |
| 2024 | $3,430 | $370,120 | $99,140 | $270,980 |
| 2023 | $3,441 | $370,120 | $99,140 | $270,980 |
| 2022 | $3,241 | $306,790 | $81,930 | $224,860 |
| 2021 | $3,017 | $271,450 | $60,620 | $210,830 |
| 2020 | $2,819 | $256,460 | $57,210 | $199,250 |
| 2019 | $2,629 | $231,210 | $51,660 | $179,550 |
| 2018 | $2,812 | $192,120 | $42,690 | $149,430 |
| 2017 | $2,500 | $192,120 | $42,690 | $149,430 |
| 2016 | $2,428 | $172,490 | $38,120 | $134,370 |
| 2015 | -- | $163,460 | $42,220 | $121,240 |
| 2014 | -- | $156,200 | $42,220 | $113,980 |
| 2013 | -- | $156,200 | $42,220 | $113,980 |
Source: Public Records
Map
Nearby Homes
- 7545 Old Military Rd NE
- 960 NE Marwood Dr
- 7701 Beacon Place NE Unit B103
- 7761 Beacon Place NE Unit 103
- 9422 Fairhaven Cir NE
- 535 NE Saturn Ln
- 6748 Scorpio Ln NE
- 404 NE Saturn Ln
- 8170 Cottage Place NE
- 575 NE Conifer Dr
- 6490 Graceland Ave NE
- 6630 NE Aquarius Ln
- 940 Yoder Ln NE
- 156 NE Zodiac Ln
- 6398 Juanita Cir NE
- 3924 McCormick Village Dr Unit 25
- 8473 Covina Loop NE
- 6530 Newaukum Place NE
- 7655 Forest Ridge Dr NE
- 0 Kaster Dr NE
- 7516 Blackbird Dr NE
- 7492 Blackbird Dr NE
- 7528 Blackbird Dr NE
- 7501 Blackbird Dr NE
- 7480 Blackbird Dr NE
- 7513 Blackbird Dr NE
- 7489 Blackbird Dr NE
- 7539 Old Military Rd NE
- 7525 Blackbird Dr NE
- 7540 Blackbird Dr NE
- 7468 Blackbird Dr NE
- 7477 Blackbird Dr NE
- 7275 Blackbird Dr NE
- 7295 Blackbird Dr NE
- 7263 Blackbird Dr NE
- 7247 Blackbird Dr NE
- 7307 Blackbird Dr NE
- 7552 Blackbird Dr NE
- 7456 Blackbird Dr NE
- 7545 Blackbird Dr NE