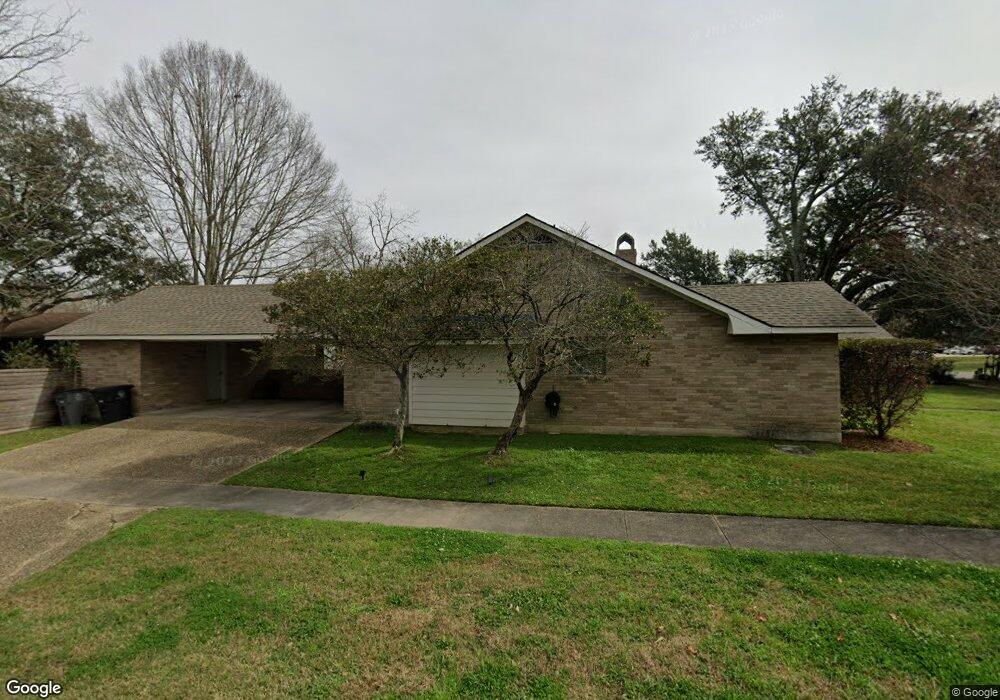
7505 Boone Ave Baton Rouge, LA 70808
Highlands/Perkins NeighborhoodEstimated Value: $357,000 - $403,000
3
Beds
3
Baths
2,161
Sq Ft
$175/Sq Ft
Est. Value
About This Home
This home is located at 7505 Boone Ave, Baton Rouge, LA 70808 and is currently estimated at $377,279, approximately $174 per square foot. 7505 Boone Ave is a home located in East Baton Rouge Parish with nearby schools including Magnolia Woods Elementary School, Glasgow Middle School, and Mckinley Senior High School.
Ownership History
Date
Name
Owned For
Owner Type
Purchase Details
Closed on
Jun 12, 2020
Sold by
Petersen Andrew and Petersen Victoria
Bought by
Hinricher Matthew
Current Estimated Value
Home Financials for this Owner
Home Financials are based on the most recent Mortgage that was taken out on this home.
Original Mortgage
$342,475
Outstanding Balance
$303,578
Interest Rate
3.2%
Mortgage Type
New Conventional
Estimated Equity
$73,701
Purchase Details
Closed on
Jan 31, 2014
Sold by
Riles Emilie C
Bought by
Petersen Andrew
Home Financials for this Owner
Home Financials are based on the most recent Mortgage that was taken out on this home.
Original Mortgage
$134,880
Interest Rate
4.49%
Mortgage Type
New Conventional
Purchase Details
Closed on
Jul 14, 2006
Sold by
Riles Earl W
Bought by
Riles Emilie C
Purchase Details
Closed on
Apr 4, 2005
Sold by
Sec Of Veteran Affairs
Bought by
Riles Earl
Create a Home Valuation Report for This Property
The Home Valuation Report is an in-depth analysis detailing your home's value as well as a comparison with similar homes in the area
Home Values in the Area
Average Home Value in this Area
Purchase History
| Date | Buyer | Sale Price | Title Company |
|---|---|---|---|
| Hinricher Matthew | $360,500 | Titleplus Llc | |
| Petersen Andrew | $68,600 | -- | |
| Riles Emilie C | $153,000 | -- | |
| Riles Earl | $153,000 | -- |
Source: Public Records
Mortgage History
| Date | Status | Borrower | Loan Amount |
|---|---|---|---|
| Open | Hinricher Matthew | $342,475 | |
| Previous Owner | Petersen Andrew | $134,880 |
Source: Public Records
Tax History Compared to Growth
Tax History
| Year | Tax Paid | Tax Assessment Tax Assessment Total Assessment is a certain percentage of the fair market value that is determined by local assessors to be the total taxable value of land and additions on the property. | Land | Improvement |
|---|---|---|---|---|
| 2024 | $4,006 | $34,200 | $3,500 | $30,700 |
| 2023 | $4,006 | $34,200 | $3,500 | $30,700 |
| 2022 | $4,084 | $34,200 | $3,500 | $30,700 |
| 2021 | $3,990 | $34,200 | $3,500 | $30,700 |
| 2020 | $2,666 | $23,000 | $2,500 | $20,500 |
| 2019 | $2,301 | $19,000 | $2,500 | $16,500 |
| 2018 | $2,273 | $19,000 | $2,500 | $16,500 |
| 2017 | $2,273 | $19,000 | $2,500 | $16,500 |
| 2016 | $1,187 | $16,850 | $2,500 | $14,350 |
| 2015 | $1,190 | $16,850 | $2,500 | $14,350 |
| 2014 | $1,186 | $16,850 | $2,500 | $14,350 |
| 2013 | -- | $16,750 | $2,500 | $14,250 |
Source: Public Records
Map
Nearby Homes
- 548 Kenilworth Pkwy
- 733 Chippenham Dr
- 521 Chippenham Dr
- 7850 Boone Ave
- 359 Chippenham Dr
- 470 Wylie Dr
- 553 Wylie Dr
- 1034 Highland Park Dr
- 8720 Menlo Dr
- 8704 Menlo Dr
- 155 Highland Park Dr
- 7391 Highland Rd
- 180 Wylie Dr
- 6964 Boone Ave
- 859 Maxine Dr
- 7825 Highland District Way
- 640 Maxine Dr
- 7850 Highland District Way
- 7855 Highland Rd
- 7865 Highland Rd
- 7527 Boone Ave
- 7502 Tipperary Dr
- 631 Daventry Dr
- 7539 Boone Ave
- 7514 Tipperary Dr
- 663 Daventry Dr
- 7526 Tipperary Dr
- 7543 Boone Ave
- 685 Daventry Dr
- 535 Daventry Dr
- 7538 Tipperary Dr
- 632 Kenilworth Pkwy
- 632 Kenilworth Pkwy
- 708 Daventry Dr
- 707 Daventry Dr
- 656 Kenilworth Pkwy
- 7607 Boone Ave
- 668 Kenilworth Pkwy
- 668 Kenilworth Pkwy
- 703 N Coventry Dr