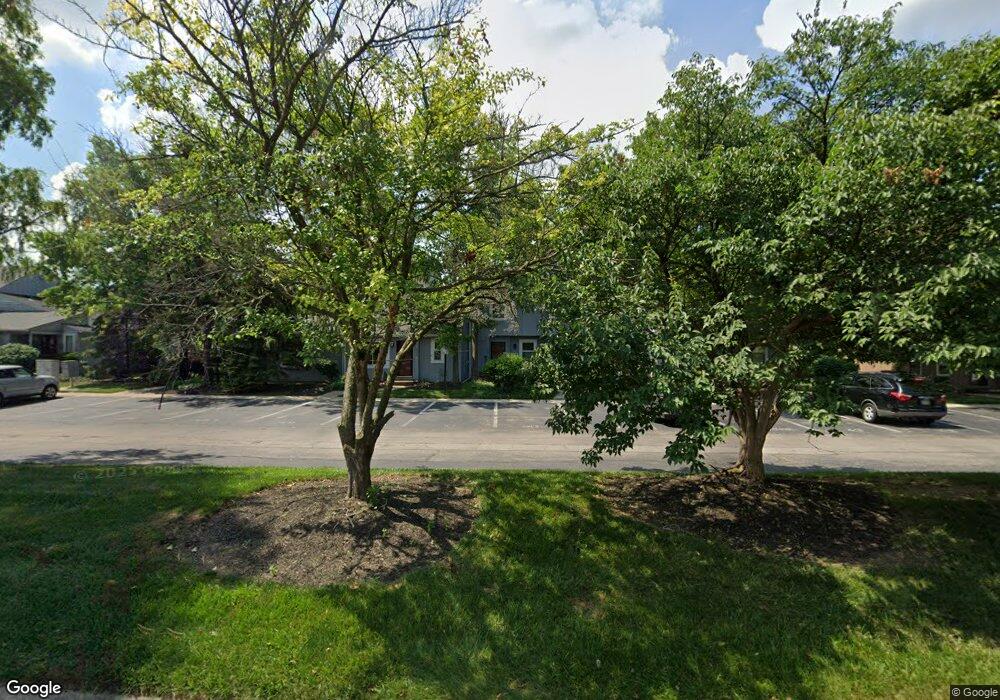
7505 Hastings Point Unit 41 West Chester, OH 45069
West Chester Township NeighborhoodEstimated Value: $160,000 - $168,000
1
Bed
2
Baths
903
Sq Ft
$182/Sq Ft
Est. Value
About This Home
This home is located at 7505 Hastings Point Unit 41, West Chester, OH 45069 and is currently estimated at $164,215, approximately $181 per square foot. 7505 Hastings Point Unit 41 is a home located in Butler County with nearby schools including Hopewell Early Childhood School, Woodland Elementary School, and Hopewell Junior School.
Ownership History
Date
Name
Owned For
Owner Type
Purchase Details
Closed on
Oct 24, 2019
Sold by
Back Barbara S
Bought by
Kahn Joel
Current Estimated Value
Home Financials for this Owner
Home Financials are based on the most recent Mortgage that was taken out on this home.
Original Mortgage
$87,500
Outstanding Balance
$76,654
Interest Rate
3.5%
Mortgage Type
New Conventional
Estimated Equity
$87,561
Purchase Details
Closed on
May 4, 1999
Sold by
Kranpitz Dawnyea L and Dorkin Dawnyea L
Bought by
Back Barbara S
Home Financials for this Owner
Home Financials are based on the most recent Mortgage that was taken out on this home.
Original Mortgage
$75,150
Interest Rate
6.99%
Mortgage Type
FHA
Purchase Details
Closed on
Jul 11, 1997
Sold by
Diane Helsinger and Diane Whitacre
Bought by
Dawnyea L Dorkin
Home Financials for this Owner
Home Financials are based on the most recent Mortgage that was taken out on this home.
Original Mortgage
$68,150
Interest Rate
8%
Mortgage Type
FHA
Purchase Details
Closed on
Oct 1, 1988
Create a Home Valuation Report for This Property
The Home Valuation Report is an in-depth analysis detailing your home's value as well as a comparison with similar homes in the area
Home Values in the Area
Average Home Value in this Area
Purchase History
| Date | Buyer | Sale Price | Title Company |
|---|---|---|---|
| Kahn Joel | $97,500 | None Available | |
| Back Barbara S | $76,900 | -- | |
| Dawnyea L Dorkin | $69,755 | -- | |
| -- | $49,500 | -- |
Source: Public Records
Mortgage History
| Date | Status | Borrower | Loan Amount |
|---|---|---|---|
| Open | Kahn Joel | $87,500 | |
| Previous Owner | Back Barbara S | $75,150 | |
| Previous Owner | Dawnyea L Dorkin | $68,150 |
Source: Public Records
Tax History Compared to Growth
Tax History
| Year | Tax Paid | Tax Assessment Tax Assessment Total Assessment is a certain percentage of the fair market value that is determined by local assessors to be the total taxable value of land and additions on the property. | Land | Improvement |
|---|---|---|---|---|
| 2024 | $1,756 | $42,340 | $5,600 | $36,740 |
| 2023 | $1,744 | $42,340 | $5,600 | $36,740 |
| 2022 | $1,792 | $31,960 | $5,600 | $26,360 |
| 2021 | $1,628 | $30,700 | $5,600 | $25,100 |
| 2020 | $1,666 | $30,700 | $5,600 | $25,100 |
| 2019 | $2,264 | $23,630 | $5,600 | $18,030 |
| 2018 | $1,347 | $23,630 | $5,600 | $18,030 |
| 2017 | $1,371 | $23,630 | $5,600 | $18,030 |
| 2016 | $1,455 | $23,630 | $5,600 | $18,030 |
| 2015 | $1,444 | $23,630 | $5,600 | $18,030 |
| 2014 | $2,189 | $23,630 | $5,600 | $18,030 |
| 2013 | $2,189 | $22,310 | $6,300 | $16,010 |
Source: Public Records
Map
Nearby Homes
- 7541 Granby Way Unit 89
- 7531 Exchequer Ct
- 7506 Parliament Ct Unit 149
- 8253 Lake Ridge Dr
- 8166 Shadybrook Dr
- 6729 Maverick Dr
- 7574 Barret Rd
- 7594 Barret Rd
- 7331 Jean Dr
- 8199 Vadith Ct
- 7985 Kenneth St
- 7203 Cherrywood Ln
- 7661 Brookdale Dr
- 8558 Cox Rd
- 8430 Meadowlark Ct
- 7329 Chatham Ct
- 8698 Cox Rd
- 7436 Wetherington Dr
- 7986 Tylers Way
- 8749 Monticello Dr
- 7505 Hastings Point
- 7503 Hastings Point
- 7507 Hastings Point Unit 40
- 7501 Hastings Point Unit 43
- 7509 Hastings Point
- 7495 Hastings Point
- 7508 Easton Ct
- 7500 Easton Ct
- 7498 Easton Ct
- 7517 Hastings Point
- 7493 Hastings Point
- 7510 Easton Ct
- 7496 Easton Ct
- 7512 Easton Ct Unit 56
- 7494 Easton Ct
- 7519 Hastings Point Unit 37
- 7491 Hastings Point
- 7514 Easton Ct Unit 57
- 7521 Hastings Point
- 7492 Easton Ct