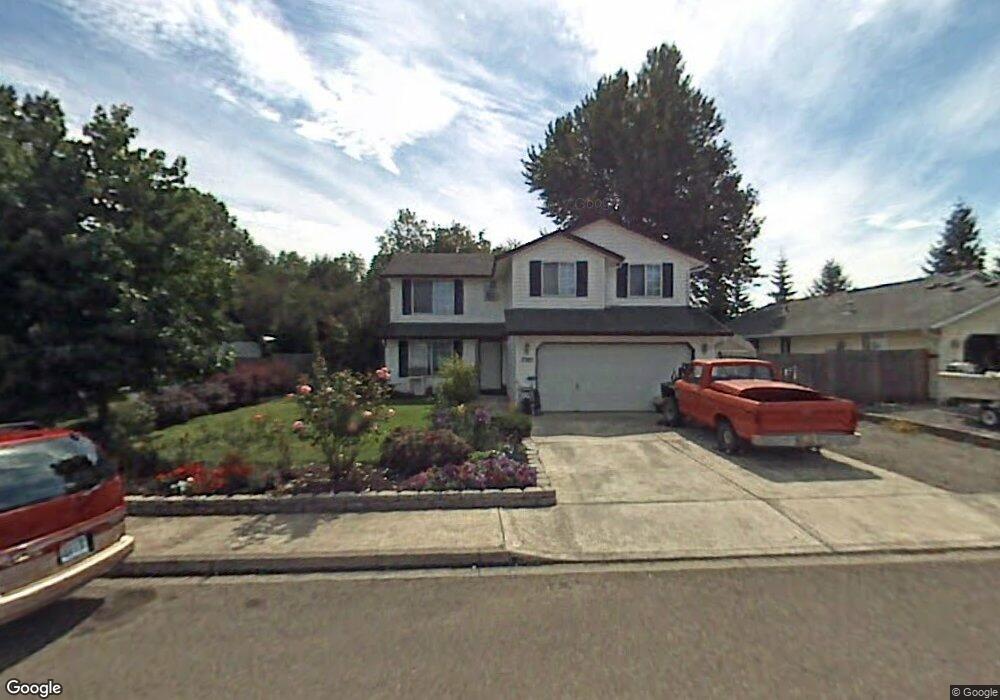
7505 NE 87th St Vancouver, WA 98662
Estimated Value: $497,000 - $517,000
3
Beds
3
Baths
1,884
Sq Ft
$268/Sq Ft
Est. Value
About This Home
This home is located at 7505 NE 87th St, Vancouver, WA 98662 and is currently estimated at $505,472, approximately $268 per square foot. 7505 NE 87th St is a home located in Clark County with nearby schools including Glenwood Heights Primary School, Laurin Middle School, and Prairie High School.
Ownership History
Date
Name
Owned For
Owner Type
Purchase Details
Closed on
Apr 27, 2023
Sold by
Flatt Lea
Bought by
Flatt Lea and Flatt Gene
Current Estimated Value
Home Financials for this Owner
Home Financials are based on the most recent Mortgage that was taken out on this home.
Original Mortgage
$150,000
Outstanding Balance
$145,986
Interest Rate
6.6%
Mortgage Type
Credit Line Revolving
Estimated Equity
$359,486
Purchase Details
Closed on
Oct 7, 1998
Sold by
Upton Rolland H and Upton Jane E
Bought by
Sivils Lea
Home Financials for this Owner
Home Financials are based on the most recent Mortgage that was taken out on this home.
Original Mortgage
$133,078
Interest Rate
6.88%
Mortgage Type
FHA
Purchase Details
Closed on
Oct 19, 1995
Sold by
Commemorative Homes Inc
Bought by
Upton Rolland H and Upton Jane E
Home Financials for this Owner
Home Financials are based on the most recent Mortgage that was taken out on this home.
Original Mortgage
$83,900
Interest Rate
7.59%
Create a Home Valuation Report for This Property
The Home Valuation Report is an in-depth analysis detailing your home's value as well as a comparison with similar homes in the area
Home Values in the Area
Average Home Value in this Area
Purchase History
| Date | Buyer | Sale Price | Title Company |
|---|---|---|---|
| Flatt Lea | -- | Wfg National Title | |
| Sivils Lea | $145,000 | Chicago Title Insurance Co | |
| Upton Rolland H | $119,900 | First American Title Ins Co |
Source: Public Records
Mortgage History
| Date | Status | Borrower | Loan Amount |
|---|---|---|---|
| Open | Flatt Lea | $150,000 | |
| Previous Owner | Sivils Lea | $133,078 | |
| Previous Owner | Upton Rolland H | $83,900 |
Source: Public Records
Tax History Compared to Growth
Tax History
| Year | Tax Paid | Tax Assessment Tax Assessment Total Assessment is a certain percentage of the fair market value that is determined by local assessors to be the total taxable value of land and additions on the property. | Land | Improvement |
|---|---|---|---|---|
| 2025 | $3,564 | $455,100 | $193,500 | $261,600 |
| 2024 | $3,169 | $414,011 | $193,500 | $220,511 |
| 2023 | $3,408 | $453,538 | $183,500 | $270,038 |
| 2022 | $3,158 | $406,142 | $183,500 | $222,642 |
| 2021 | $3,052 | $341,392 | $119,250 | $222,142 |
| 2020 | $3,023 | $298,829 | $105,600 | $193,229 |
| 2019 | $2,609 | $288,315 | $105,600 | $182,715 |
| 2018 | $3,024 | $282,439 | $0 | $0 |
| 2017 | $2,681 | $248,716 | $0 | $0 |
| 2016 | $2,612 | $235,787 | $0 | $0 |
| 2015 | $2,580 | $211,237 | $0 | $0 |
| 2014 | -- | $197,125 | $0 | $0 |
| 2013 | -- | $178,936 | $0 | $0 |
Source: Public Records
Map
Nearby Homes
- 7501 NE 87th St
- 8712 NE Centerpointe Dr
- 8111 NE 88th St
- 9311 NE 72nd Ave
- 7618 NE Meadows Dr
- 8800 NE 82nd St
- 8003 NE 87th Ave
- 6628 NE 75th St
- 10020 NE 82nd Ave
- 9610 NE 87th Ave
- 9006 NE 89th Cir
- 9011 NE 89th Cir
- 11003 NE 64th Ct Unit Lot 7
- 10917 NE 64th Ct
- 11015 NE 64th Ct Unit Lot 10
- 11007 NE 64th Ct Unit Lot 8
- 11101 NE 64th Ct Unit Lot 14
- 6904 NE 70th St
- 6307 NE Wilding Rd
- 10400 NE 82nd Ave Unit 18
- 7507 NE 87th St
- 7503 NE 87th St
- 7601 NE 87th St
- 8704 NE 76th Ave
- 7417 NE 87th Cir
- 7418 NE 87th Cir
- 8705 NE 76th Ave
- 0 E 76th Ave
- 7605 NE 87th St
- 7415 NE 87th Cir
- 8708 NE 76th Ave
- 7416 NE 87th Cir
- 8709 NE 76th Ave
- 7609 NE 87th St
- 7604 NE 87th St
- 7414 NE 87th Cir
- 7413 NE 87th Cir
- 8712 NE 76th Ave
- 7608 NE 87th St
- 7411 NE 87th Cir