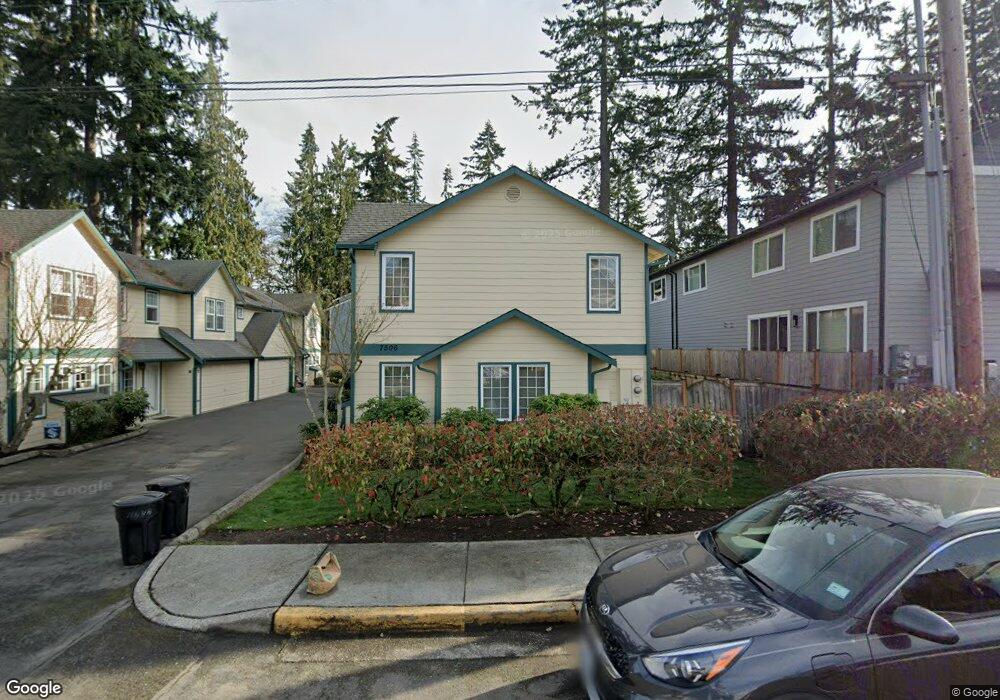
7506 210th St SW Unit A Edmonds, WA 98026
Seattle Heights NeighborhoodEstimated Value: $493,000 - $565,062
3
Beds
3
Baths
1,344
Sq Ft
$396/Sq Ft
Est. Value
About This Home
This home is located at 7506 210th St SW Unit A, Edmonds, WA 98026 and is currently estimated at $532,766, approximately $396 per square foot. 7506 210th St SW Unit A is a home located in Snohomish County with nearby schools including College Place Elementary School, College Place Middle School, and Edmonds-Woodway High School.
Ownership History
Date
Name
Owned For
Owner Type
Purchase Details
Closed on
Aug 4, 2005
Sold by
Woods Christopher M and Woods Emily A
Bought by
Hale Thomas A
Current Estimated Value
Home Financials for this Owner
Home Financials are based on the most recent Mortgage that was taken out on this home.
Original Mortgage
$24,950
Interest Rate
5.05%
Mortgage Type
Unknown
Purchase Details
Closed on
Dec 27, 2000
Sold by
Glenn Laura Elaine
Bought by
Woods Christopher M and Woods Emily A
Home Financials for this Owner
Home Financials are based on the most recent Mortgage that was taken out on this home.
Original Mortgage
$174,066
Interest Rate
7.71%
Mortgage Type
FHA
Purchase Details
Closed on
Oct 11, 1995
Sold by
T & T South
Bought by
Glenn Laura Elaine
Home Financials for this Owner
Home Financials are based on the most recent Mortgage that was taken out on this home.
Original Mortgage
$123,400
Interest Rate
7.8%
Create a Home Valuation Report for This Property
The Home Valuation Report is an in-depth analysis detailing your home's value as well as a comparison with similar homes in the area
Home Values in the Area
Average Home Value in this Area
Purchase History
| Date | Buyer | Sale Price | Title Company |
|---|---|---|---|
| Hale Thomas A | $250,230 | Stewart Title Of Snohomish C | |
| Woods Christopher M | $179,450 | Equity Title Company | |
| Glenn Laura Elaine | $2,313 | -- |
Source: Public Records
Mortgage History
| Date | Status | Borrower | Loan Amount |
|---|---|---|---|
| Closed | Hale Thomas A | $24,950 | |
| Open | Hale Thomas A | $199,950 | |
| Previous Owner | Woods Christopher M | $174,066 | |
| Previous Owner | Glenn Laura Elaine | $123,400 |
Source: Public Records
Tax History Compared to Growth
Tax History
| Year | Tax Paid | Tax Assessment Tax Assessment Total Assessment is a certain percentage of the fair market value that is determined by local assessors to be the total taxable value of land and additions on the property. | Land | Improvement |
|---|---|---|---|---|
| 2025 | $3,428 | $497,000 | $70,000 | $427,000 |
| 2024 | $3,428 | $485,000 | $62,000 | $423,000 |
| 2023 | $3,036 | $445,000 | $55,000 | $390,000 |
| 2022 | $3,308 | $399,000 | $46,000 | $353,000 |
| 2020 | $3,329 | $358,000 | $52,000 | $306,000 |
| 2019 | $3,118 | $338,000 | $49,500 | $288,500 |
| 2018 | $3,224 | $302,000 | $47,500 | $254,500 |
| 2017 | $2,905 | $285,000 | $43,500 | $241,500 |
| 2016 | $2,436 | $237,000 | $43,500 | $193,500 |
| 2015 | $2,358 | $216,000 | $43,500 | $172,500 |
| 2013 | $1,656 | $143,100 | $49,500 | $93,600 |
Source: Public Records
Map
Nearby Homes
- 7505 212th St SW Unit C301
- 7503 212th St SW Unit B102
- 7503 212th St SW Unit B302
- 20714 76th Ave W Unit 11
- 7207 210th St SW Unit 202
- 7207 210th St SW Unit 102
- 20620 76th Ave W Unit A
- 7924 212th St SW Unit 211
- 7924 212th St SW Unit 104
- 20721 81st Ave W
- 6918 208th St SW Unit 208
- 18502 18510 76th Ave W
- 7707 203rd St SW
- 8225 212th St SW Unit 304
- 7702 202nd Place SW
- 8004 203rd Place SW
- 21224 82nd Place W
- 7909 218th St SW Unit 4
- 7606 201st St SW Unit G
- 228 xx 84th Ave W
- 7506 210th St SW
- 7506 210th #A7506 St SW Unit A7506
- 7506 210th St SW Unit 2
- 7506 210th St SW Unit 1
- 7508 210th St SW
- 7434 210th St SW Unit 1
- 7434 210th St SW
- 7529 210th St SW
- 7511 210th St SW Unit 3
- 7511 210th St SW Unit 2
- 7511 210th St SW Unit 1
- 7504 210th St SW Unit 2
- 7504 210th St SW Unit 1
- 7504 210th St SW Unit A
- 7504 210th St SW Unit B
- 7505 210th St SW Unit 12
- 7505 210th St SW Unit 11
- 7505 210th St SW Unit 10
- 7539 210th St SW
- 21023 76th Ave W Unit 10